
EUR/USD
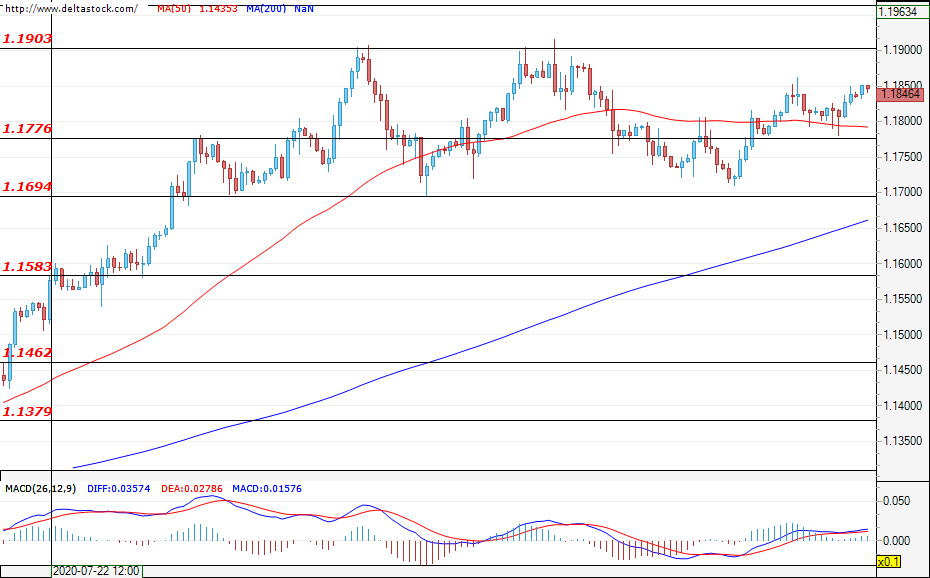
Current level – 1.1847
The bears’ attempts from the end of last week to break through 1.1776 were unsuccessful. The EUR got some positions back against the USD as trading continues in the middle of the formed range between 1.1776 and 1.1903. A test of the resistance zone at 1.1903 is highly probable. A breakthrough here could easily lead to a future rise and new gains for the euro. If bears re-enter the market, the first support zone lies at 1.1776, where a successful breach could deepen the decline and push the currency pair to the lower zone at 1.1694.
| Resistance | Support | ||
| intraday | intraweek | intraday | intraweek |
| 1.1903 | 1.2080 | 1.1815 | 1.1580 |
| 1.2080 | 1.2200 | 1.1776 | 1.1460 |
USD/JPY
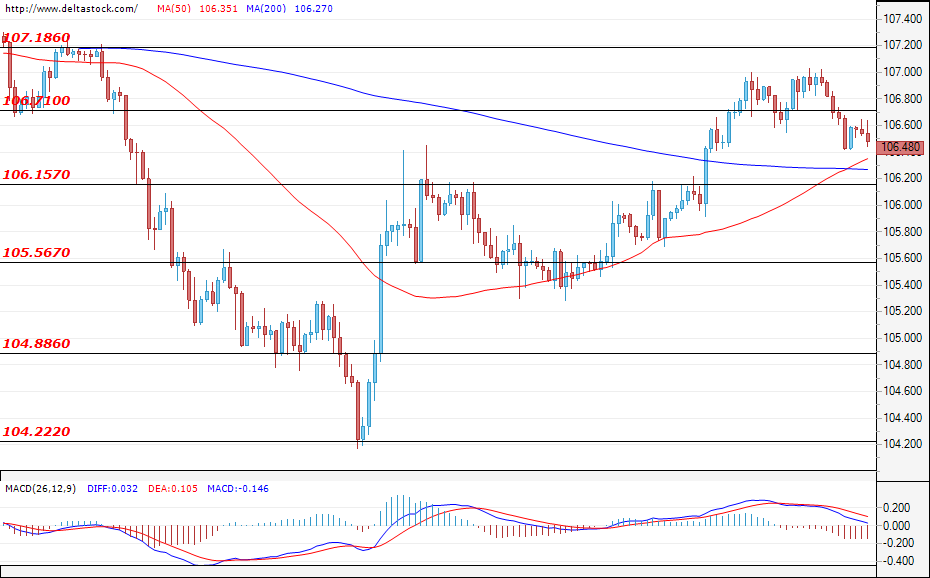
Current level – 106.48
The currency pair successfully breached the support zone at 106.71 as the price is hovering around the current level at 106.52. If the negative push persists, we could witness a test of the next target at 106.15, where a success would change the current sentiments of the market participants and lead to future losses for the USD/JPY. In the alternative scenario, if bulls take control, the first target for them would be an attempt to breach towards the previously mentioned zone at 106.71, acting now as a resistance, and a new test of the local highs around 107.18.
| Resistance | Support | ||
| intraday | intraweek | intraday | intraweek |
| 106.71 | 107.50 | 106.15 | 104.85 |
| 107.18 | 108.10 | 105.55 | 104.20 |
GBP/USD
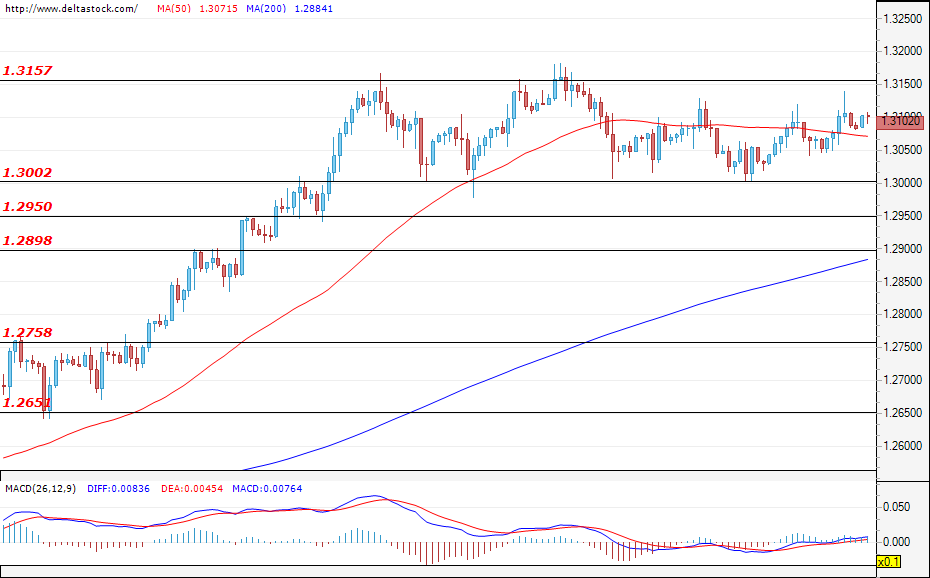
Current level – 1.3102
Neither the bulls, nor the bears had enough power to lead the Cable out of the trading range between1.3002 and 1.3157 that was formed from the beginning of the month. The price consolidated closer to the upper border after the start of trading today. Only a successful breach will draw a more bullish picture for the future path of the GBP/USD and lead to new gains. Any downward moves should be limited to the support zones at 1.2950.
| Resistance | Support | ||
| intraday | intraweek | intraday | intraweek |
| 1.3160 | 1.3200 | 1.3002 | 1.2898 |
| 1.3160 | 1.3300 | 1.2950 | 1.2758 |