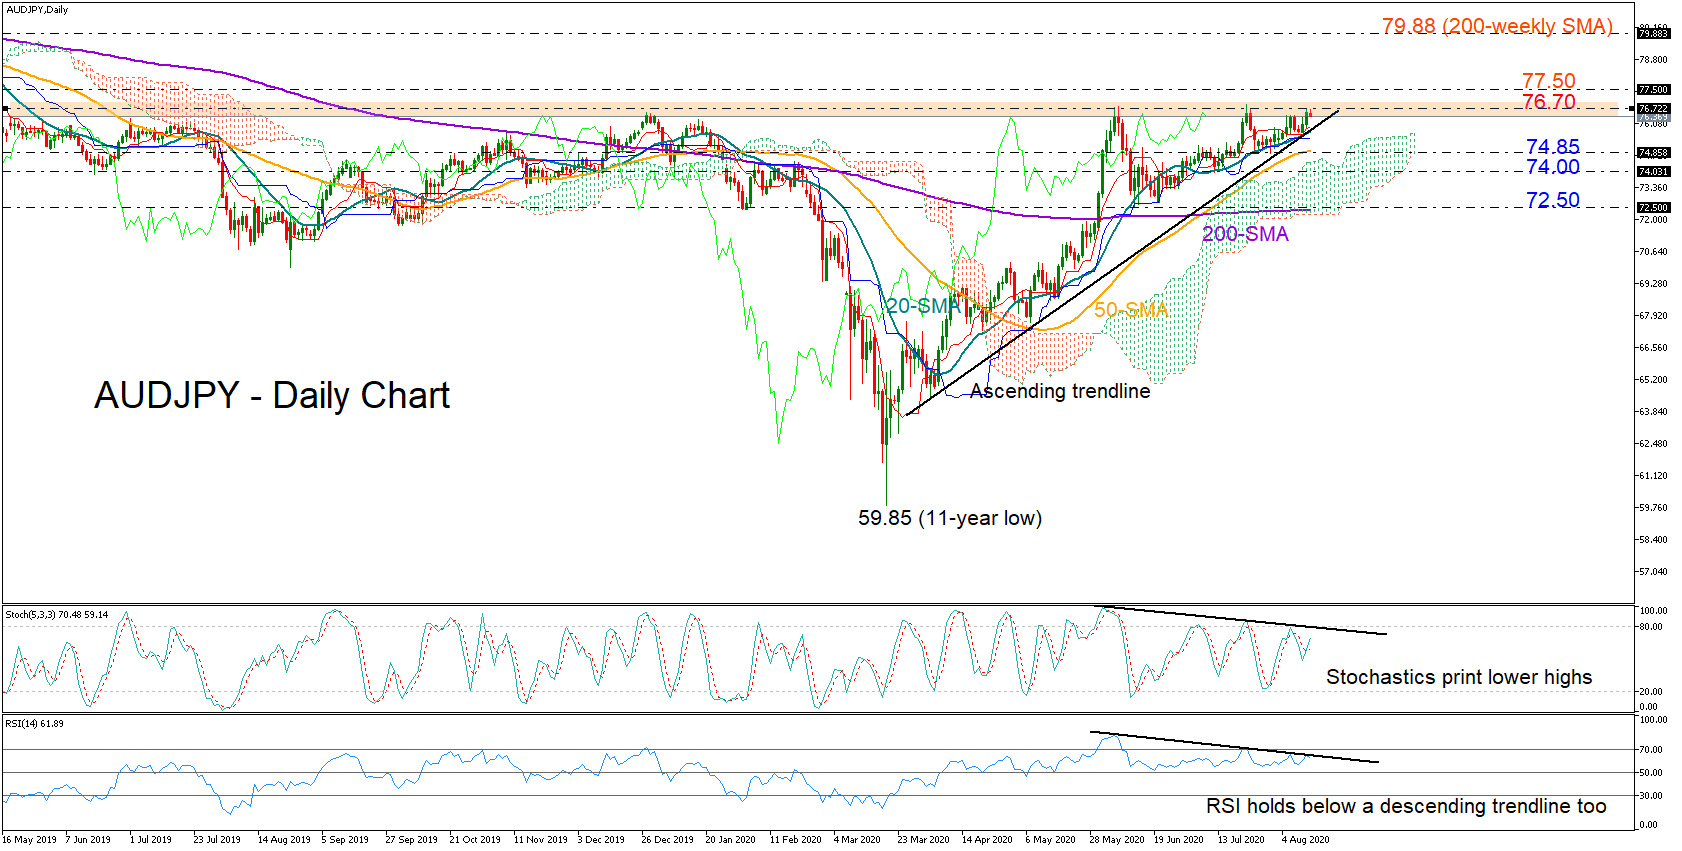
AUDJPY stepped on the supportive ascending trendline earlier this week and shifted north again to fight the heavy ceiling around 76.70, which has been active since June 2016.
While the RSI and the Stochastics continue to consolidate within the bullish area, they have been printing lower highs over the past two months in contrast to the price which has been holding around the upper surface of its range. The pattern reminds a bearish divergence structure and could be a signal that the bears are preparing to step in.
What could trigger a bearish action though, is a close below the trendline currently around the 20-day simple moving average (SMA) at 75.65. In this case, the price could dive into the 74.85-74.00 support region, a break of which could see the retest of the 72.50 low taken from June 12 and the 200-day SMA slightly beneath.
Otherwise, a bounce above the 76.70 wall could bring fresh buying into the market, with immediate resistance likely emerging near 77.50. Higher, the rally could accelerate towards the key 79.88 barrier, where the 200-SMA is flattening in the weekly chart.
Summarizing, AUDJPY seems to be facing a fading short-term bullish bias. A climb above the tough 76.70 resistance could reject that view and upgrade the short- and long-term outlook instead, while a cross below the trendline could confirm it.