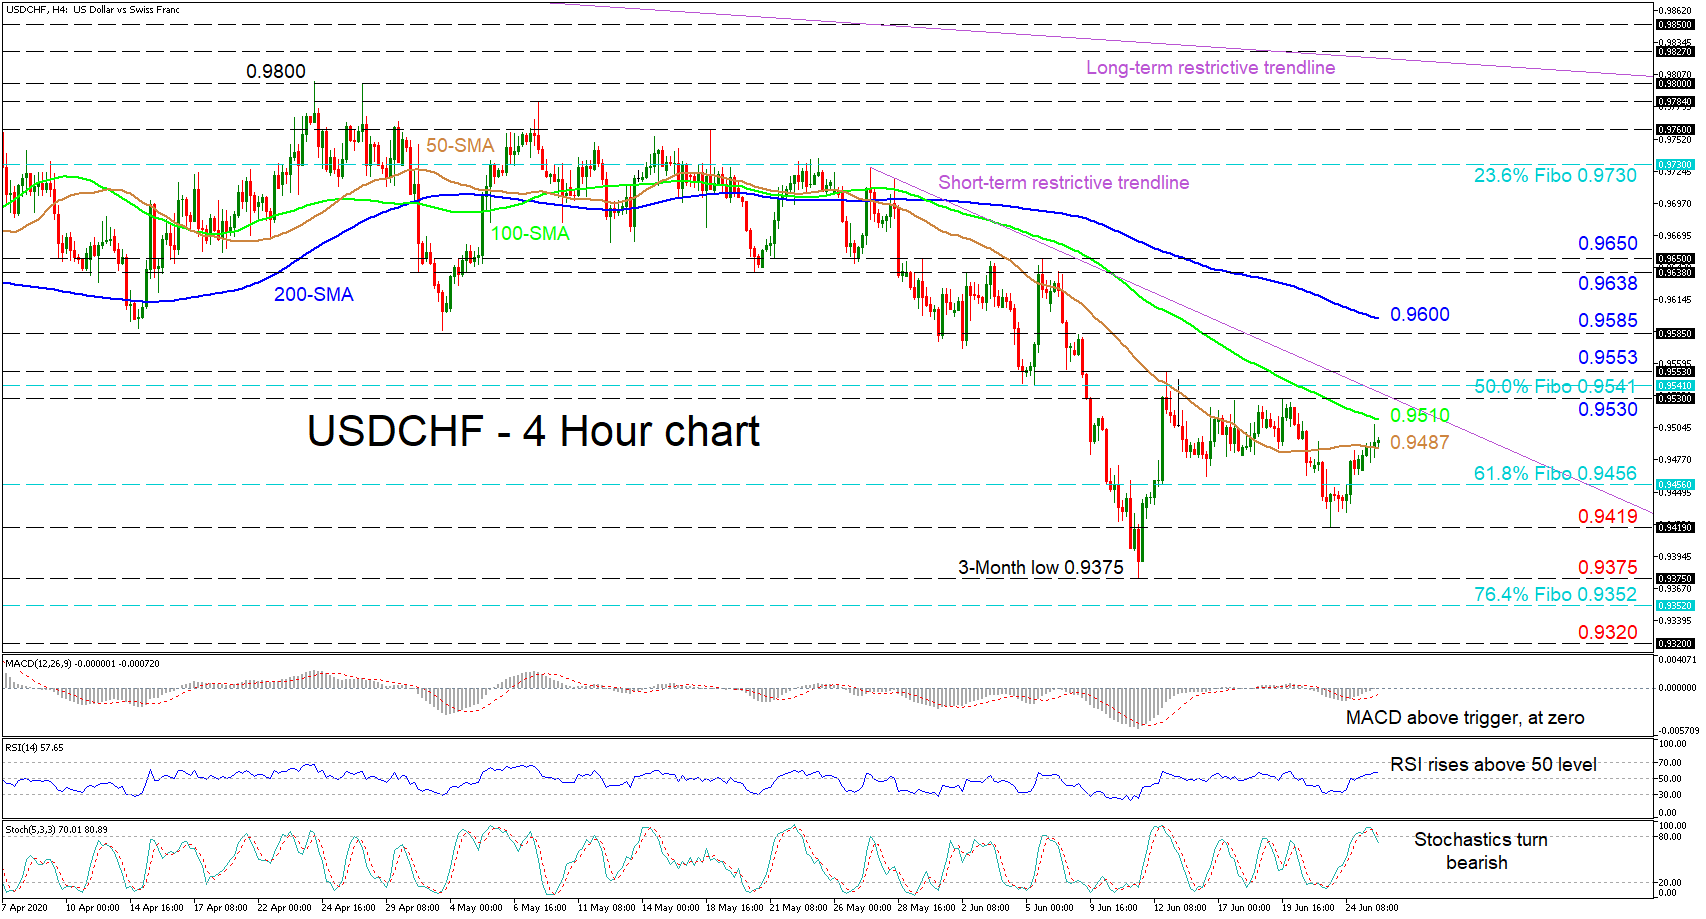
USDCHF climbed above the 50-period simple moving average (SMA) in attempts to boost positive momentum in an already prevailing negative structure. The falling 100- and 200-period SMAs support the negative picture while the 50-period SMA suggests the pair may drag on to challenge the short-term descending line drawn from May 27.
The short-term oscillators reflect conflicting signals of directional momentum. The MACD has moved above its red signal line in the negative region and up to the zero mark, while the RSI is slightly improving above 50. However, confirming negative tendencies are the stochastic lines, which have completed a bearish crossover out of the overbought territory.
If buyers manage to drive the price up, the 100-period SMA at 0.9510 could provide initial deterrence towards a tough resistance region from 0.9530 – 0.9553, shifting the outlook from bearish to neutral. The area is fortified by a near-term diagonal line and the 0.9541 level, which is the 50.0% Fibonacci retracement of the up leg from 0.9182 – 0.9900. Conquering this critical resistance trench, the pair may target the 0.9585 high and the 200-period SMA at 0.9600 overhead. If price gains endure, this may lead to the 0.9638 – 0.9650 area of peaks ahead of the 23.6% Fibo of 0.9730.
Otherwise, if the pair falls back below 0.9487, initial support could develop at the 61.8% Fibo of 0.9456 prior to the 0.9419 low. If the negative trend resumes, and penetrates below the three-month trough of 0.9375, the decline may be challenged by the 76.4% Fibo of 0.9352 ahead of the 0.9320 obstacle.
Overall, the short-term bias is bearish under the falling line and the 0.9530 mark. Yet, a clearer direction may unfold once the price nears the restrictive trend line.