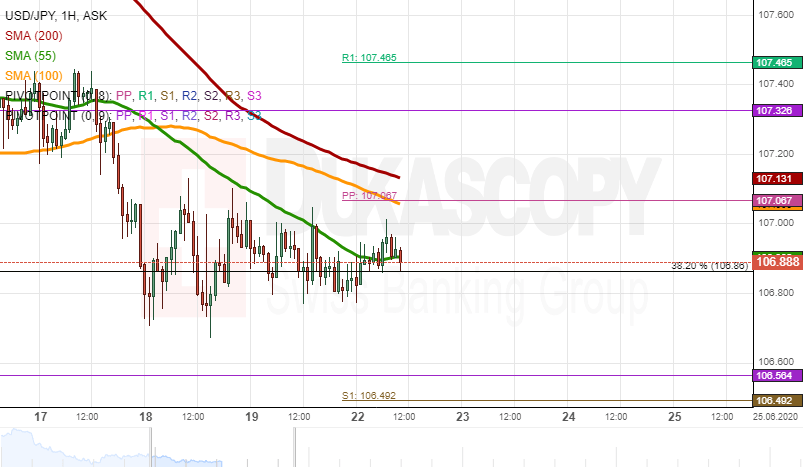
The USD/JPY has continued to trade in the range between the 106.80 and 107.00 levels. In theory, any sideways trading ends. It can end by surging or declining.
In the case of a decline, the rate could be pushed down by the 55, 100 and 200-hour simple moving averages. In this scenario, the pair would have to pass the support of the 106.80 level. Afterwards, the rate would aim at the support of the monthly pivot point at the 106.56 level.
If the pair surges, it would first need to test the combined resistance of the 100 and 200-hour SMAs and the weekly simple pivot point at 107.07. If these levels fail to provide resistance, the USD/JPY could reach for the monthly pivot point at 107.33.