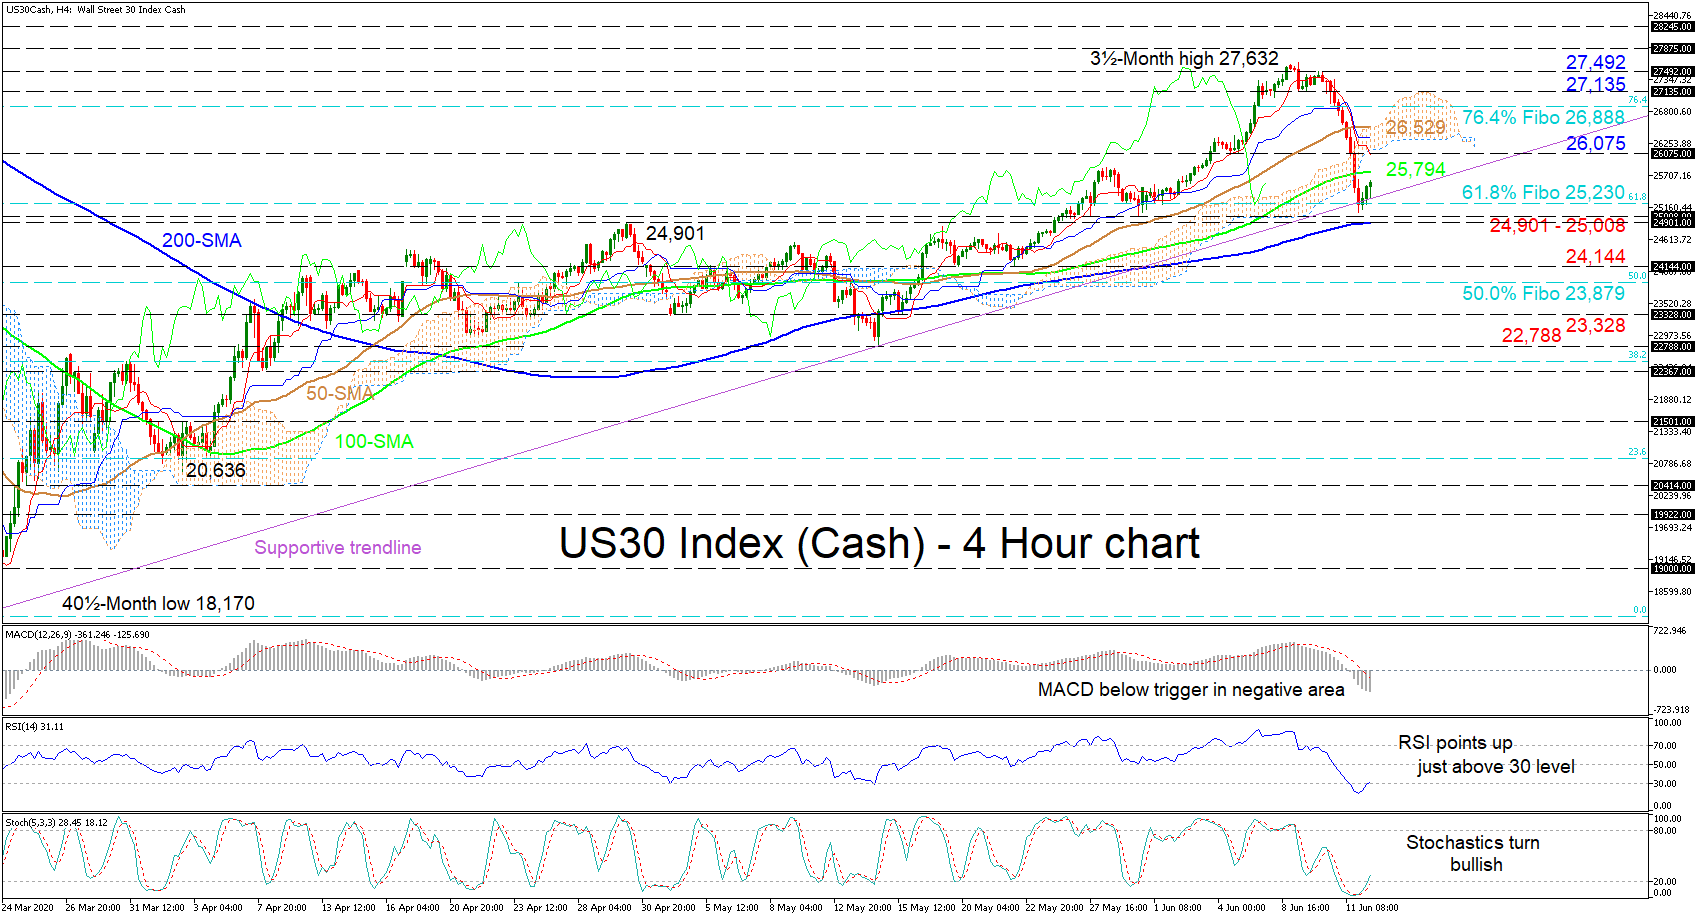
US 30 Index (Cash) found some footing on the supportive trend line at the 25,230 level, that being the 61.8% Fibonacci retracement of the down leg from the all-time high of 29,582.61 to the 40½-month low of 18,170. Negative pressures have risen, as the index has aggressive weakened in the last couple of days. Yet, the Ichimoku indicator is reflecting weakness while the rising trend line and the simple moving averages (SMAs) back an improving picture.
The short-term oscillators currently also reflect conflicting signals. The MACD is distancing itself below its red signal line in the negative region, promoting losses, while the RSI and the stochastic lines are attempting to exit the oversold territory, to realign their compass with the positive picture.
To the downside, immediate support could occur at the trend line and the 61.8% Fibo of 25,230. Slightly underneath, if the crucial support area from 24,901 – 25,008, which involves the 200-period SMA, fails to halt attempts to decline, the index may dive towards the 24,144 low and the 50.0% Fibo of 23,879. Steeper losses may stretch until the 23,328 obstacle and the 22,788 significant trough.
Should buyers’ foothold prove sufficient, resistance could commence at the 100-period SMA at 25,794. Higher, an obstructing section from the 26,075 hurdle to the 50-period SMA at 26,529 could prevent the price reaching the 76.4% Fibo of 26,888 and the cloud’s upper surface at the 27,135 resistance. Overrunning these could turn the focus to the 27,492 peak and the three-and-a-half month top of 27,632.
Summarizing, the short-term bullish bias appears to have been rekindled with the bounce on the diagonal line. However, the index would have to remain above the 24,901 mark and the 200-period SMA.