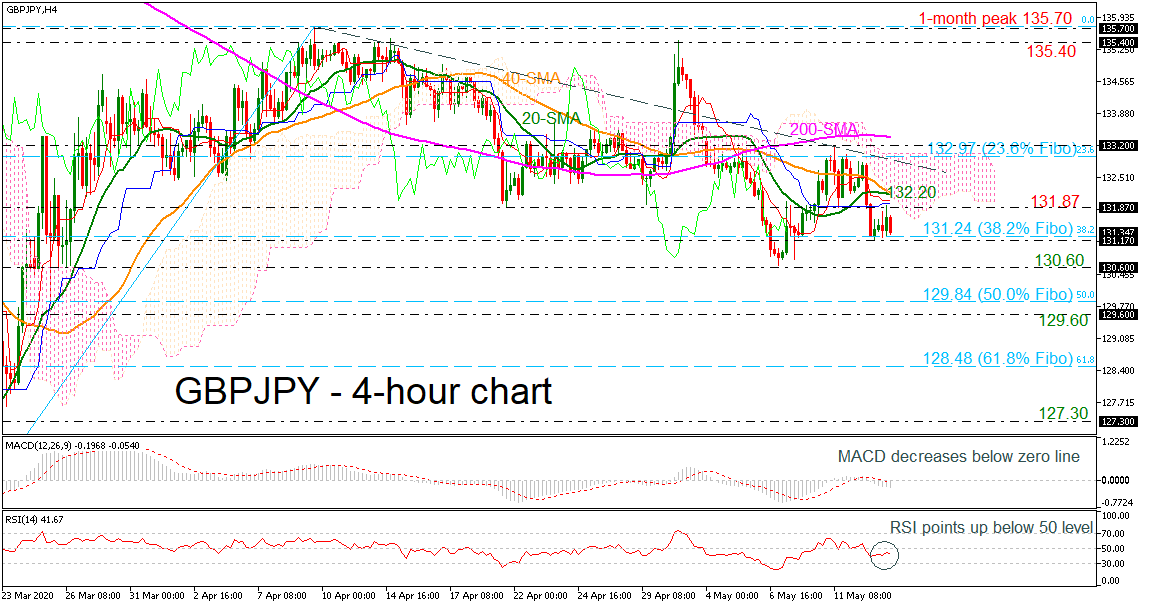
GBPJPY has come under renewed selling pressure, falling back below its 20- and 40-period simple moving average (SMA), but remaining slightly above the 38.2% Fibonacci retracement level of the up leg from 124.00 to 135.70 at 131.24.
Looking at momentum oscillators on the 4-hour chart though, they suggest further declines may be on the cards. The RSI is below its neutral 50 line, detecting negative momentum, and is also pointing downwards. The MACD, already negative, lies below its trigger line.
More declines could send prices towards the 38.2% Fibo at 131.24 and the 131.17 barrier, while more losses could find the next support at the 130.60 region. Clearing this zone, steeper negative movement could see the 50.0% Fibo at 129.84 and 129.60 come into play.
On the flipside, if the bulls retake control, price advances may stall initially near the latest highs at 131.87 subsequently near the lower surface of the Ichimoku lines. A potential upside violation of the aforementioned level would also coincide with a break of the SMAs at 132.20, raising the likelihood for more advances. In such a case, the 132.97 – the 23.6% Fibo – and the 133.20 could act as barriers to the upside before touching the 200-period SMA at 133.38.
In the bigger picture, the pair is bearish as long as it holds below the 200-period SMA. In case it violates this line, the bulls could take the upper hand.