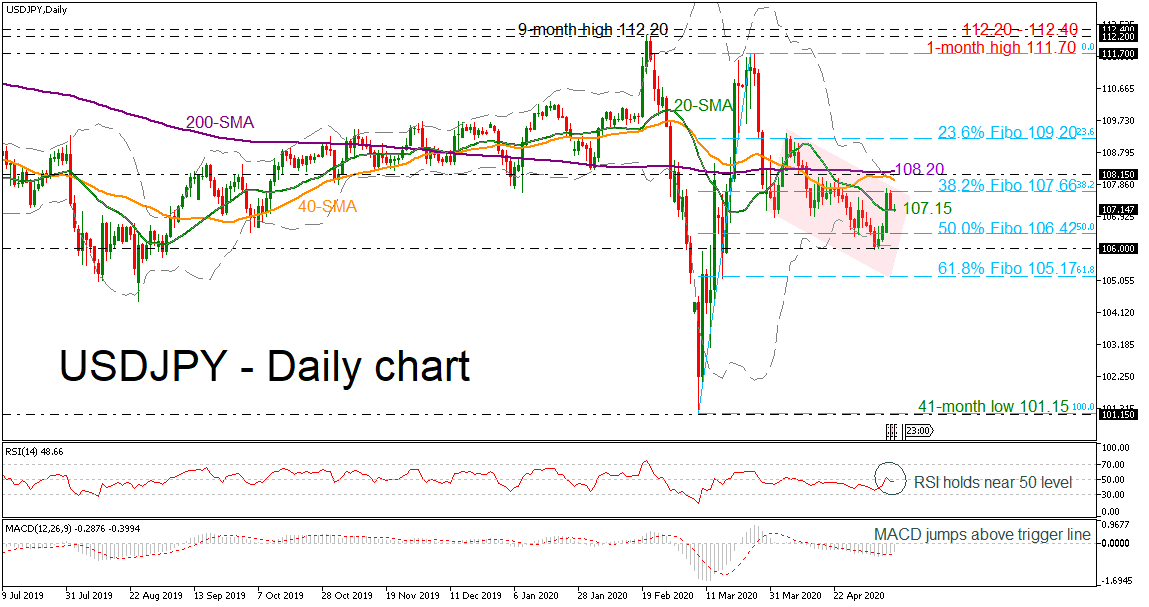
USDJPY is heading lower, flirting with the 20-day simple moving average while the price has been remaining in a downward sloping channel since April 6. The flat 200-day SMA and the horizontal RSI indicator are endorsing the weak momentum on price. However, the MACD oscillator is creating a bullish crossover with its trigger line, suggesting a potential upside tendency in the near term.
More negative pressures would send the price to check the 50.0% Fibonacci retracement level of the up leg from 101.15 to 111.70 at 106.42. If traders continue to sell the pair, it could rest near the latest low at 106.00, which overlaps with the lower Bollinger band before meeting the 61.8% Fibonacci of 105.17.
Alternatively, if there is a climb above the 38.2% Fibonacci of 107.66, strong resistance, which lies near the 40-day SMA, the 200-day SMA, the upper Bollinger band and the 108.15 barrier, could come. If the price overcomes with critical level, the 23.6% Fibonacci of 109.20 could come into spotlight. Higher still, USDJPY could hit the one-month peak of 111.70.
To sum up, the market has been in a descending move over the last month, failing to improve the previous days’ upside rally.