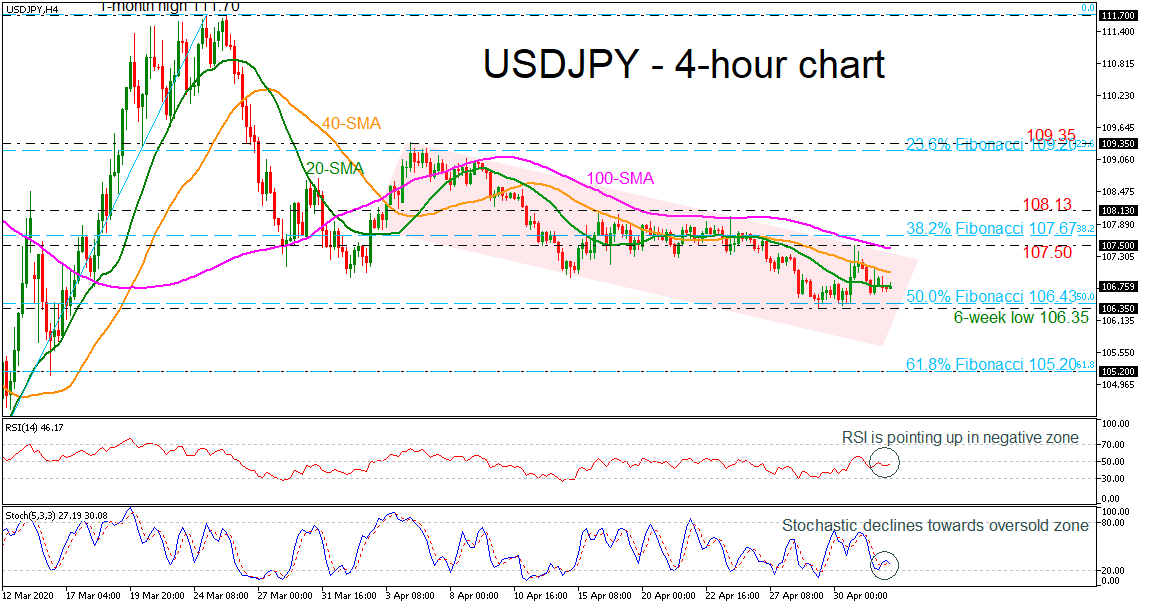
USDJPY has been trading within a descending channel over the last month, hitting a fresh six-week low at 106.35 on April 29. The price is currently capped by the simple moving averages (SMAs) in the 4-hour chart, while the RSI is marginally pointing up in the negative zone. However, the stochastic oscillator is ready for a bearish cross within its %K and %D lines above the oversold area.
A continuation of the selling mode would drive the market to retest the 50.0% Fibonacci retracement level of the up leg from 101.15 to 111.70 at 106.43 and the six-week low of 106.35. More aggressive losses could last until a strong bearish movement until the 61.8% Fibonacci of 105.20.
Alternatively, a step above the 20- and 40-period SMA could open the door for the 100-period SMA around the 107.50 resistance level and the 38.2% Fibonacci of 107.67. Higher still, the pair could rest near the 108.13 barrier, taken from the peaks on April 16.
Overall, USDJPY looks negative in the short-term and neutral in the medium-term timeframe. A decisive close beneath the downward sloping could bring new sellers to the market.