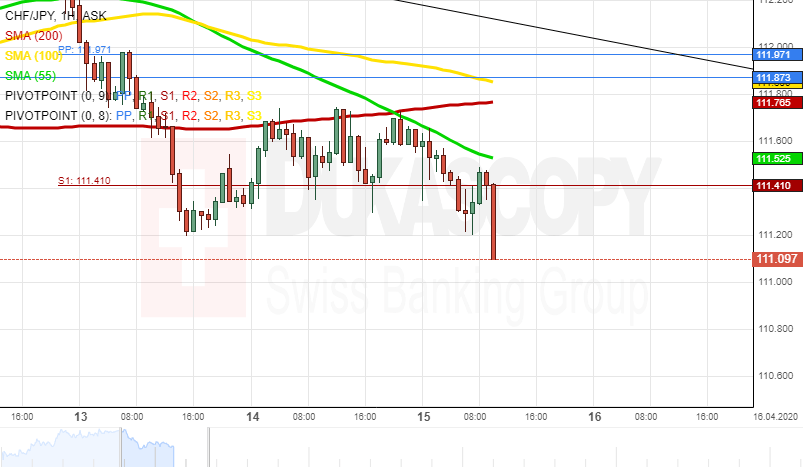
The CHF/JPY currency pair has been trading within a descending triangle pattern since the beginning of March.
From a theoretical point of view, it is likely that the exchange rate could trade within the given pattern until the end of April. Then, a breakout north could follow. In this case the rate could re-test the psychological level at 114.00.
On the other hand, the currency pair could be pressured by the 55-, 100– and 200-hour SMAs in the 111.50/111.85 area and breach the given pattern south in the nearest future. Note that the pair could gain support from the Fibo 23.60% and the monthly S1 in the 100.00 area.