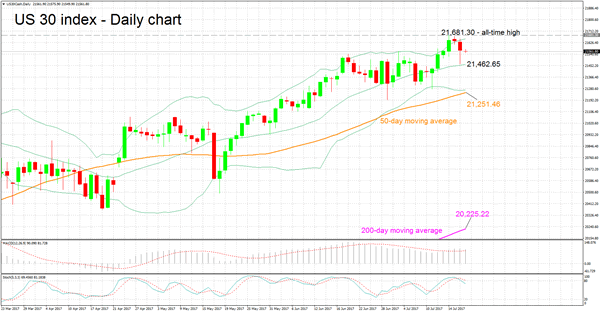
The US 30 index reached an all-time high of 21,681.30 during Friday’s trading. It has been declining so far this week but remains close to the all-time high level.
The MACD indicator is positive and above the red signal line, suggesting a bullish bias in place. Despite this, the momentum in the very short-term seems to be negative as indicated by the stochastics. Specifically, the %K line is heading lower after crossing below the slow %D line.
Should the index advance, a barrier to the upside might be formed by the upper Bollinger band and the index’s all-time high, ranging from 21,654.49 to 21,681.30. If there is a cross above this area, additional resistance could come around the 22,000 level, a potential psychological level.
On the downside, support might be found around the middle Bollinger line, which is a 20-day moving average (MA) line, at 21,462.65. If this is violated, additional support could come from the lower Bollinger band and 50-day MA, ranging from 21,270.48 to 21,252.46.
Concluding with the medium-term picture, it is strongly bullish given the significant gains by the index since the start of the year. It is of note though, that the considerable divergence between the index value and the 200-day MA might be a warning sign of an overextended rally.

