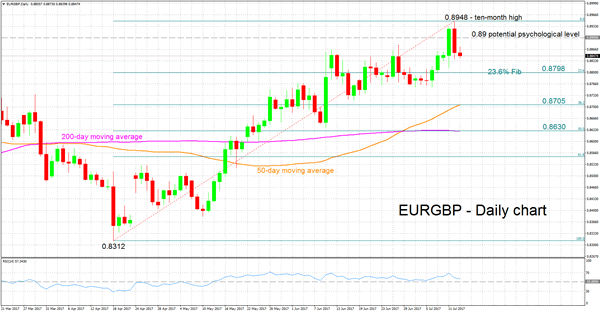
EURGBP hit a ten-month high of 0.8948 in yesterday’s trading before declining to finish the day 0.8% lower.
The RSI indicator is theoretically in bullish territory at 57 but it is heading lower, hinting to a negative short-term momentum currently in place.
Should the price rise, the area around 0.89, a potential psychological level, might act as a barrier to further advancing. Stronger gains would bring into scope the area around yesterday’s ten-month high of 0.8948 for additional resistance.
If the price declines, the area around the 23.6% Fibonacci level (April 18 – July 12 upleg) at 0.8798 could provide support. Additional declines would shift focus to the 38.2% Fibonacci mark, which also currently happens to coincide with the 50-day moving average, as another support area.
Concluding with the medium-term outlook, it remains bullish as a result of significant advancing over the last three months.

