
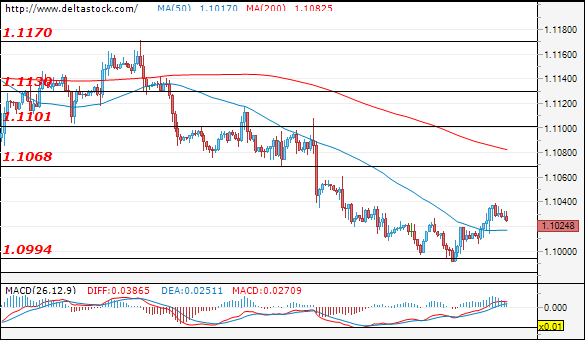
EUR/USD
Current level – 1.1024
Following the unsuccessful test of the support zone at 1.0990, the currency pair continues to trade in the narrow range 1.0990 – 1.1070 from last week. Expectations are rather positive for a test and a break of the first resistance at 1.1070. More important news for today that could trigger higher volatility is the Consumer Price Index for the Euro zone (10:00 GMT).
| Resistance | Support | ||
| intraday | intraweek | intraday | intraweek |
| 1.1070 | 1.1130 | 1.1000 | 1.0990 |
| 1.1100 | 1.1170 | 1.0990 | 1.0980 |
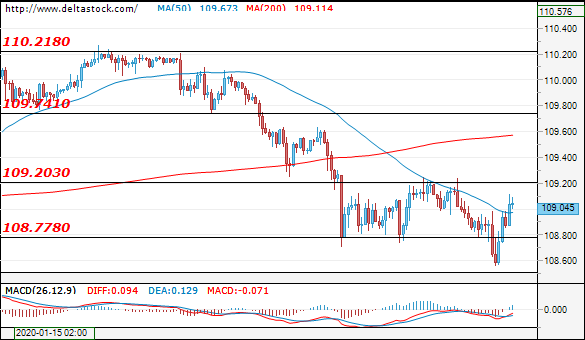
USD/JPY
Current level – 109.04
We can consider the break of the support area 108.80 for a fake one, because at the time of writing the analysis, the currency pair is in the narrow range 108.70-109.20. Sentiment is positive for a test of the resistance at 109.20, aiming the next one at 109.75. The main support is the 108.70 level.
| Resistance | Support | ||
| intraday | intraweek | intraday | intraweek |
| 109.20 | 110.22 | 108.80 | 108.40 |
| 109.75 | 111.65 | 108.40 | 107.90 |
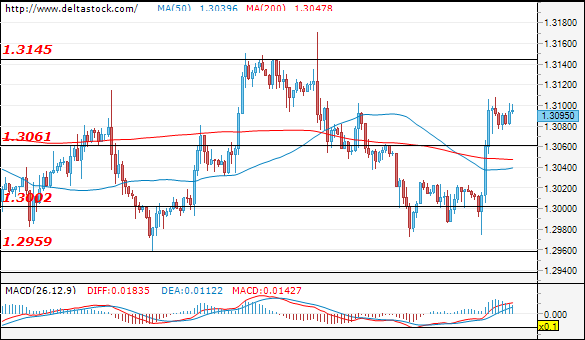
GBP/USD
Current level – 1.3095
The successful break of the static resistance level at 1.3060 gave a positive impulse to the currency pair, which could be a basis for test and break of the main resistance at 1.3145. This could lead to an increase in price momentum and a test of the next important resistance at 1.3260. We can expect some volatility during the upcoming trading sessions due to the official departure of the UK from the European Union on January 31, 23:00 GMT. Although passions have subsided after recent decisions and news around Brexit and markets have priced in the negatives and positives of those decisions, there are still many unresolved issues between the two sides, which are to be discussed in the upcoming months.
| Resistance | Support | ||
| intraday | intraweek | intraday | intraweek |
| 1.3145 | 1.3210 | 1.3060 | 1.2960 |
| 1.3210 | 1.3260 | 1.3000 | 1.2790 |