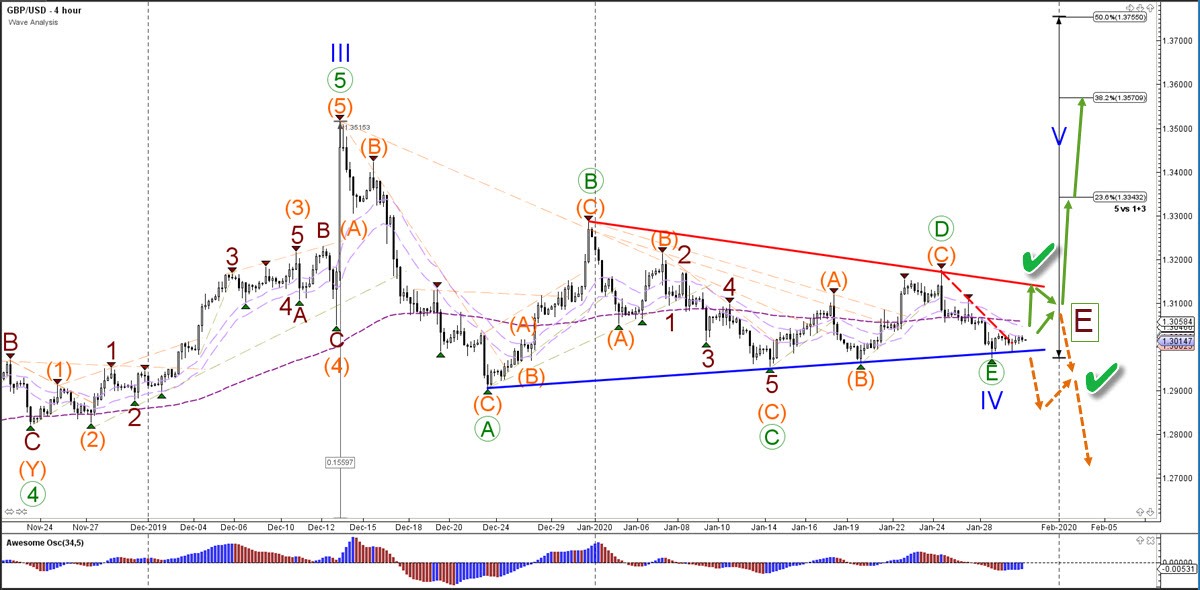
The GBP/USD could be in a bullish triangle. In that case price could have just completed the final wave E (green) pattern. This scenario is confirmed as long as price action stays above the support (blue) and if price action can break above the resistance line (red). The triangle could also be bearish. In that case, a push up could be a wave E (dark red) and price action is expected to push below the support (orange arrows).
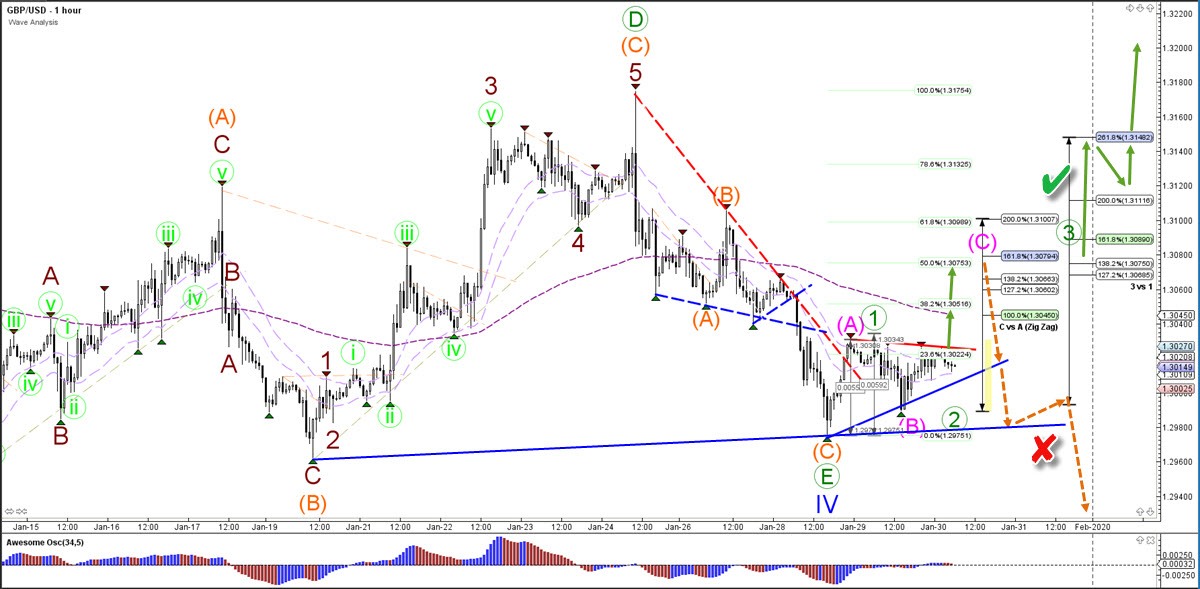
The GBP/USD could be building a bullish ABC (pink) if the triangle pattern is bearish or a 123 (green) of the triangle is bullish. A bullish triangle becomes more likely if strong impulsive price action can break above the 61.8% and 161.8% Fibs. A strong bearish bounce, however, and breakout could indicate a bearish triangle and downtrend.