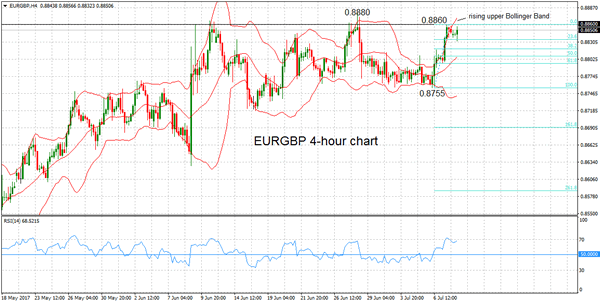
EURGBP is neutral in the short-term. The pair has been trading sideways since early June after making a substantial recovery from the April low of 0.8346. The sideways Bollinger band on the 4-hour chart is indicative of a trendless market.
After rising towards the upper Bollinger band and peaking just outside the line, prices made a corrective move lower. Meanwhile, the RSI reached overbought levels just above 70 on the 4-hour chart when the market hit a high of 0.8860 on July 7. The indicator is now flat, suggesting consolidation in the near term.
Support levels are located at key Fibonacci retracement levels of the rise from 0.8755 to 0.8860. The first support comes in at the 23.6% Fibonacci at 0.8835. Below this, further support lies at 0.8820, defined by the 38.2% Fibonacci. From here, the 50% Fibonacci at 0.8807 is the next target. The 61.8% Fibonacci at 0.8795 is located around the lower end of the recent trading range.
Should upside momentum pick up, EURGBP could see a re-test of the 0.8860 high and a break above it would open the way towards the June 28 high of 0.8880. Such a move would shift the short-term neutral bias to a bullish one, extending the recent uptrend that started from the April low of 0.8346.
Overall, the medium-term outlook is neutral to bullish as the upper Bollinger band is rising.

