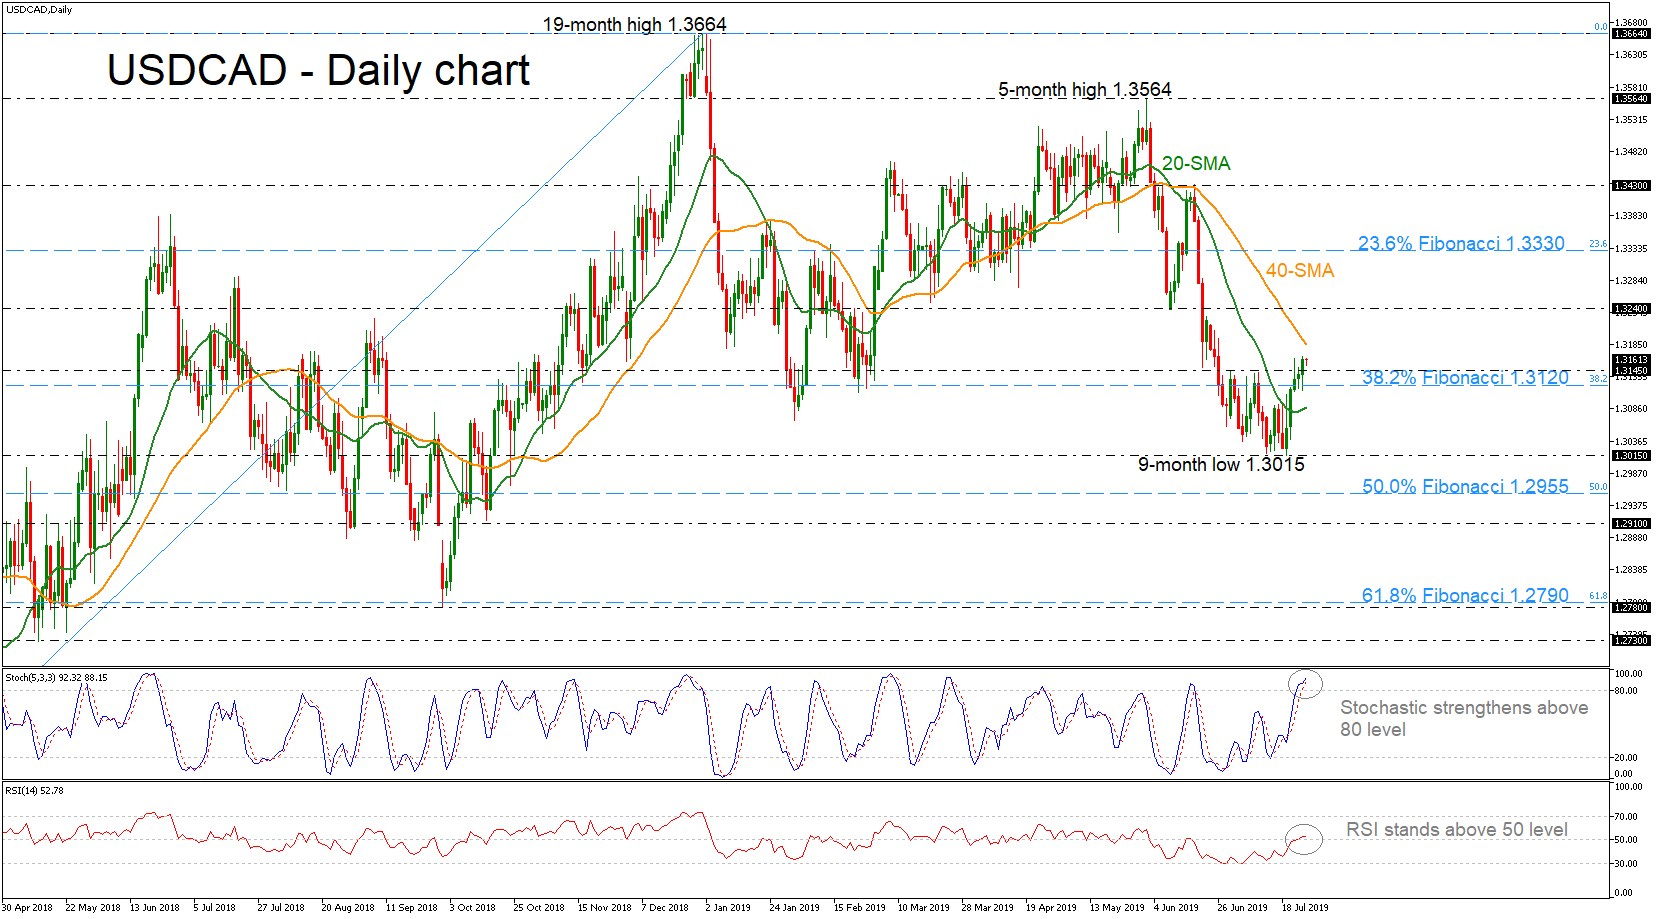
USDCAD found some footing around the nine-month low of 1.3015 last week and completed the fifth consecutive green day. Currently, the pair is approaching the 40-simple moving average (SMA), experiencing some gains above the 1.3145 barrier.
The stochastic oscillator seems to be strengthening momentum above the 80 level, while the RSI is standing above the 50 level with weaker movement than before, signaling a more cautious trading in the short term.
The 40-day SMA at 1.3182 could act as immediate resistance for the bulls. Breaking that line, the bullish action may likely continue until the 1.3240 level, taken from the inside swing low on June 10, while more advances could drive the market until the 23.6% Fibonacci retracement level of the upward wave from 1.2250 to 1.3664 around 1.3330.
In the alternative scenario, where the price closes decisively below the 1.3145 – 1.31200 zone, which encapsulates the 38.2% Fibonacci, a negative move could accelerate towards the 1.3015 region. Sharper declines would shift the attention to the 50.0% Fibo of 1.2955, continuing the bearish structure.
To sum up, the near-term risk is currently viewed bullish, while in the medium-term, the sentiment seems to be turning even more bearish.