
The EUR/USD currency pair
Technical indicators of the currency pair:
Prev Open: 1.12179
Open: 1.11924
% chg. over the last day: -0.17
Day’s range: 1.11872 – 1.12024
52 wk range: 1.1111 – 1.2009
EUR/USD keeps showing a negative trend. Yesterday the trading instrument updated the local minimums. In May, the inflation in the EU slowed down to 1.2% year-to-year. The EU is under pressure due to the comments by the head of the CBE. Mario Draghi mentioned that the regulator is willing to review additional sanctions to stimulate the economy. The quotes are consolidating around 1.11800-1.12100. The investors are waiting for the Federal Reserve to announce the new rate. It’s expected that it will remain the same. However, the meeting may be used to send some signals for the further decrease of the rates next year. Keep an eye on the comments and rhetorics of the Central Bank representatives.
At 21:00 (GMT+3:00) the Federal Reserve will announce the key interest rate.
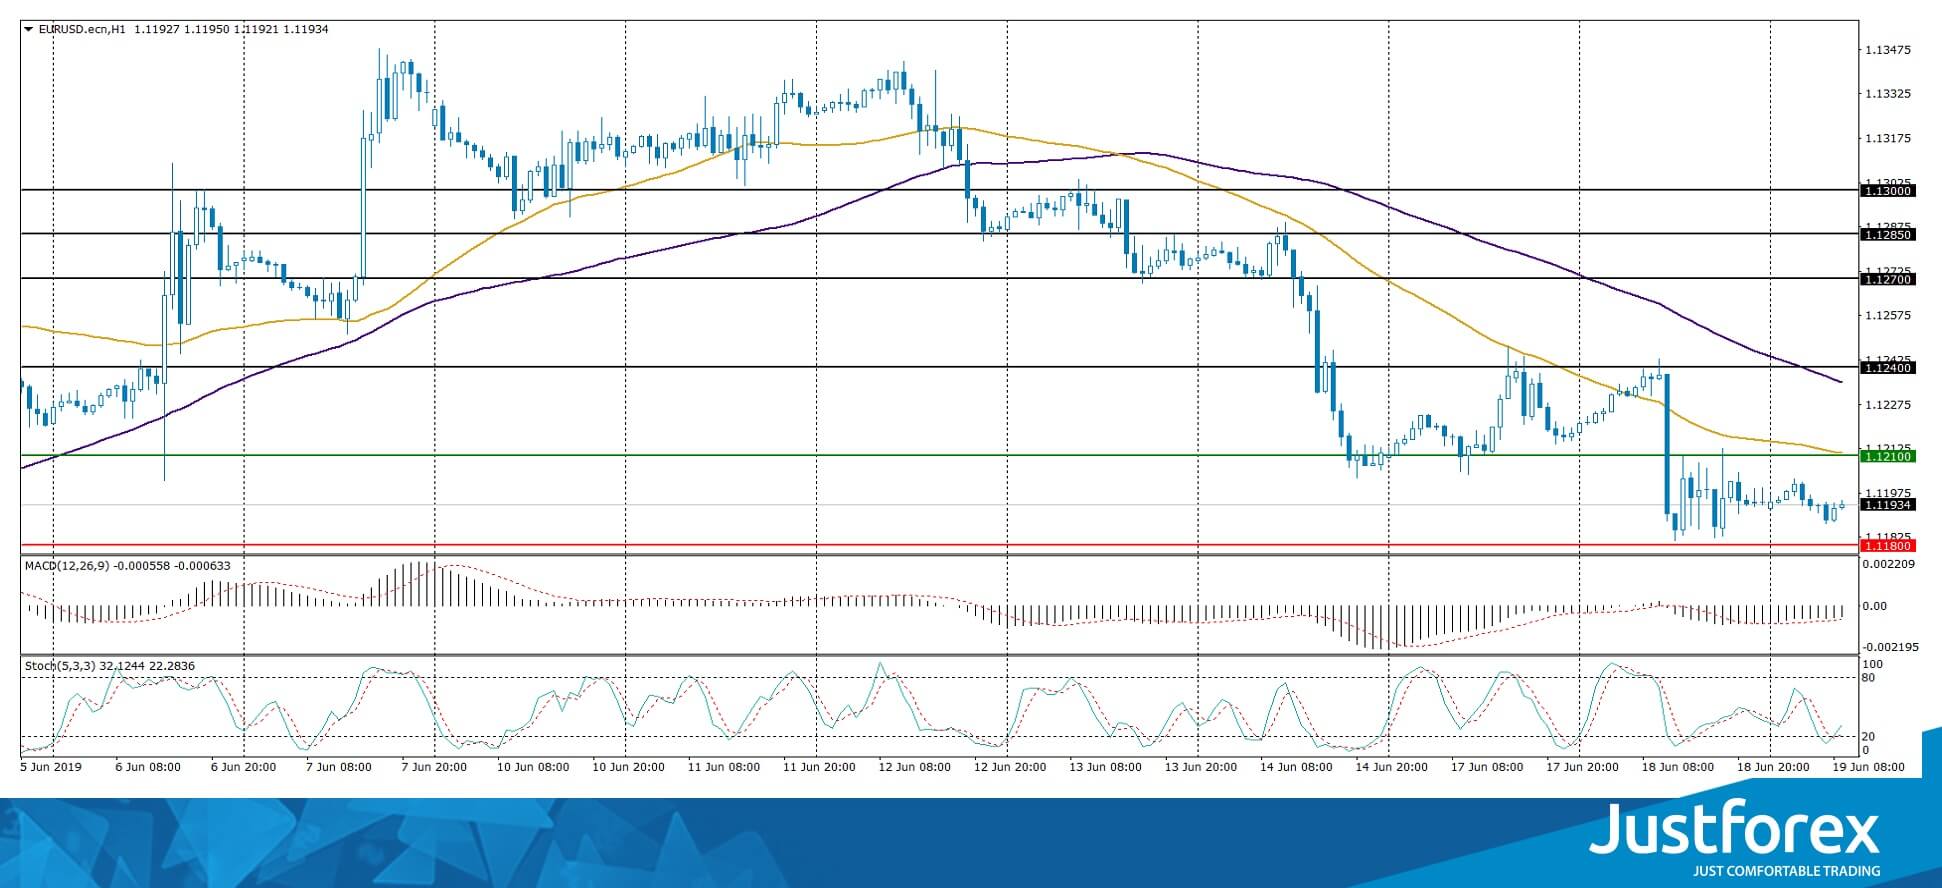
The price fixed below 50 MA and 100 MA which points to the power of the sellers.
The MACD histogram is in the negative zone but above the signal line which gives a weak signal to sell EUR/USD.
The Stochastic Oscillator is near the oversold zone, the %K line is crossing the %D line. There are no signals at the moment.
Trading recommendations
Support levels: 1.11800, 1.11500
Resistance levels: 1.12100, 1.12400, 1.12700
If the price fixes below 1.11800, expect further descend towards 1.11500-1.11200.
Alternatively, the quotes can recover towards 1.12400-1.12700.
The GBP/USD currency pair
Technical indicators of the currency pair:
Prev Open: 1.25318
Open: 1.25566
% chg. over the last day: +0.26
Day’s range: 1.25517 – 1.25698
52 wk range: 1.2438 – 1.3631
GBP/USD stabilized after a long descend. The GBP is consolidating around 1.24450-1.25800. The market participants are waiting for the UK inflation report. Keep tracking the Brexit issue and open positions from the key levels. The quotes can correct soon.
At 11:30 (GMT+3:00) the UK will publish a consumer price index.
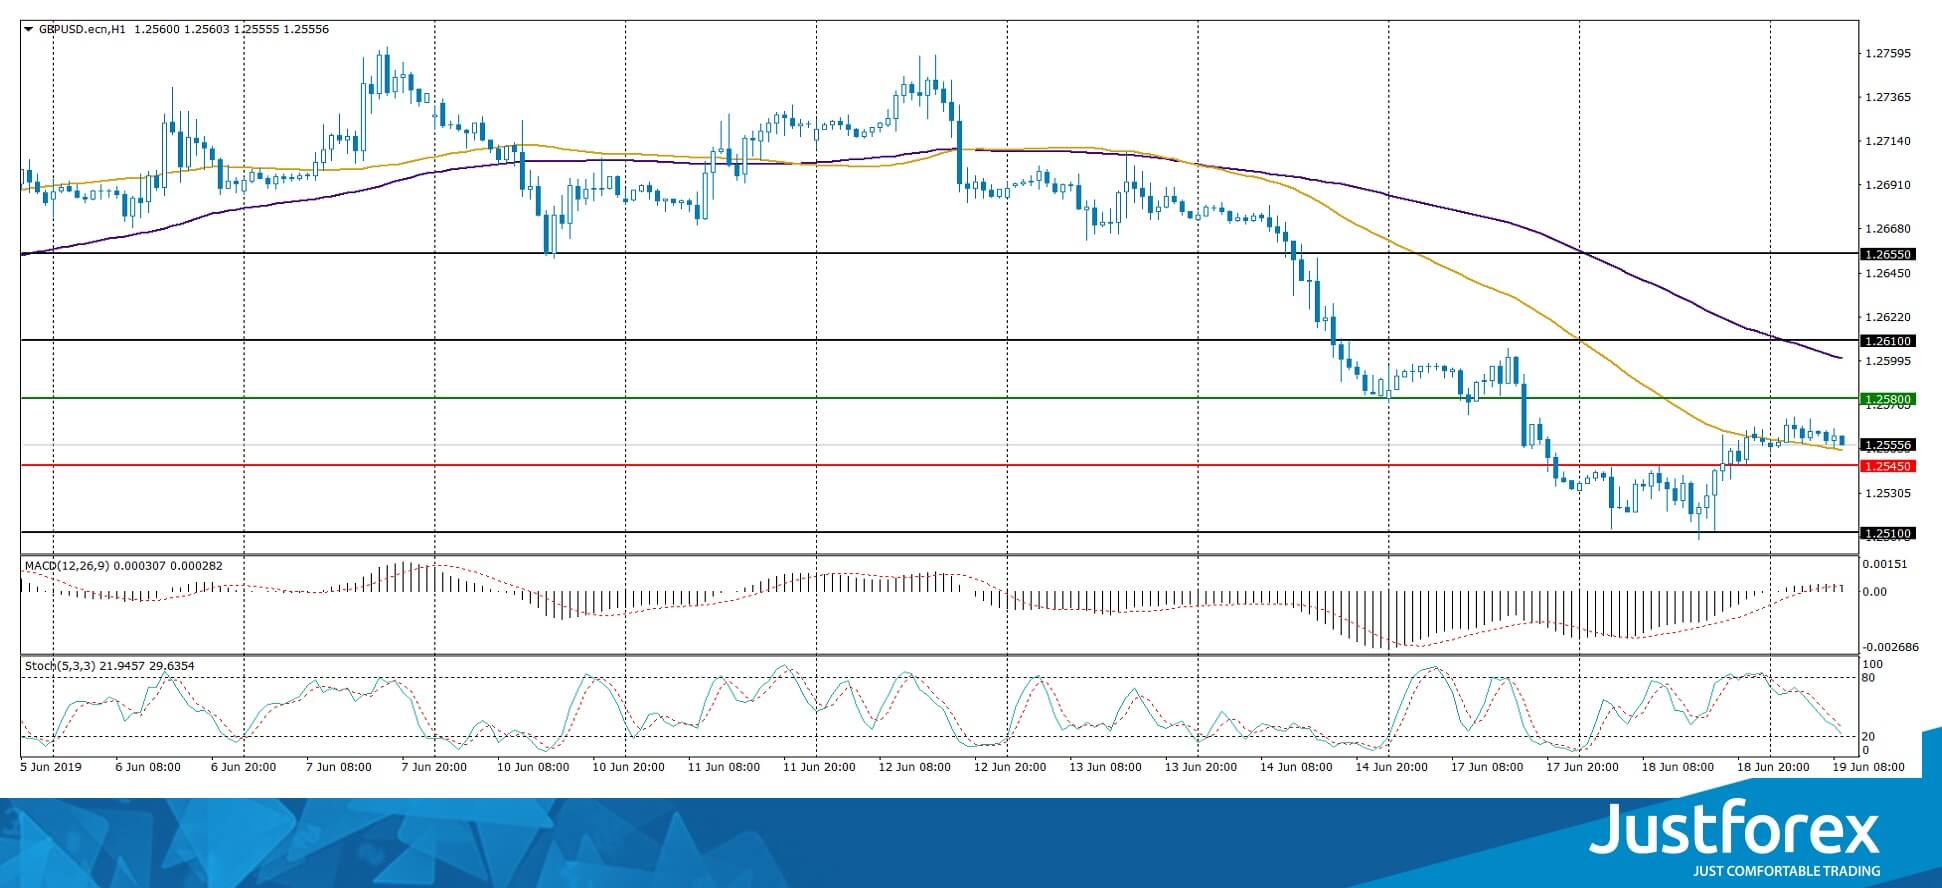
The indicators do not provide precise signals, the price has crossed 50 MA.
The MACD histogram is in the positive zone which points to the power of the buyers..
The Stochastic Oscillator is in the neutral zone, the %K line is below the %D line which gives a signal to sell GBP/USD.
Trading recommendations
Support levels: 1.25450, 1.25100
Resistance levels: 1.25800, 1.26100, 1.26550
If the price fixes above 1.25800, expect further correction towards 1.26100-1.26500.
Alternatively, the quotes can fall towards 1.25100-1.25000.
The USD/CAD currency pair
Technical indicators of the currency pair:
Prev Open: 1.34121
Open: 1.33780
% chg. over the last day: -0.29
Day’s range: 1.33648 – 1.33820
52 wk range: 1.2727 – 1.3664
USD/CAD started to descend after a long rally. CAD set the new local minimums. The quotes are consolidating around 1.33650-1.33900. The trading instrument can correct further. We expect important reports from Canada. Keep an eye on the US news feed and oil quotes dynamics, open positions from the key levels.
Basis consumer price index in Canada will be published at 15:30 (GMT+3:00)
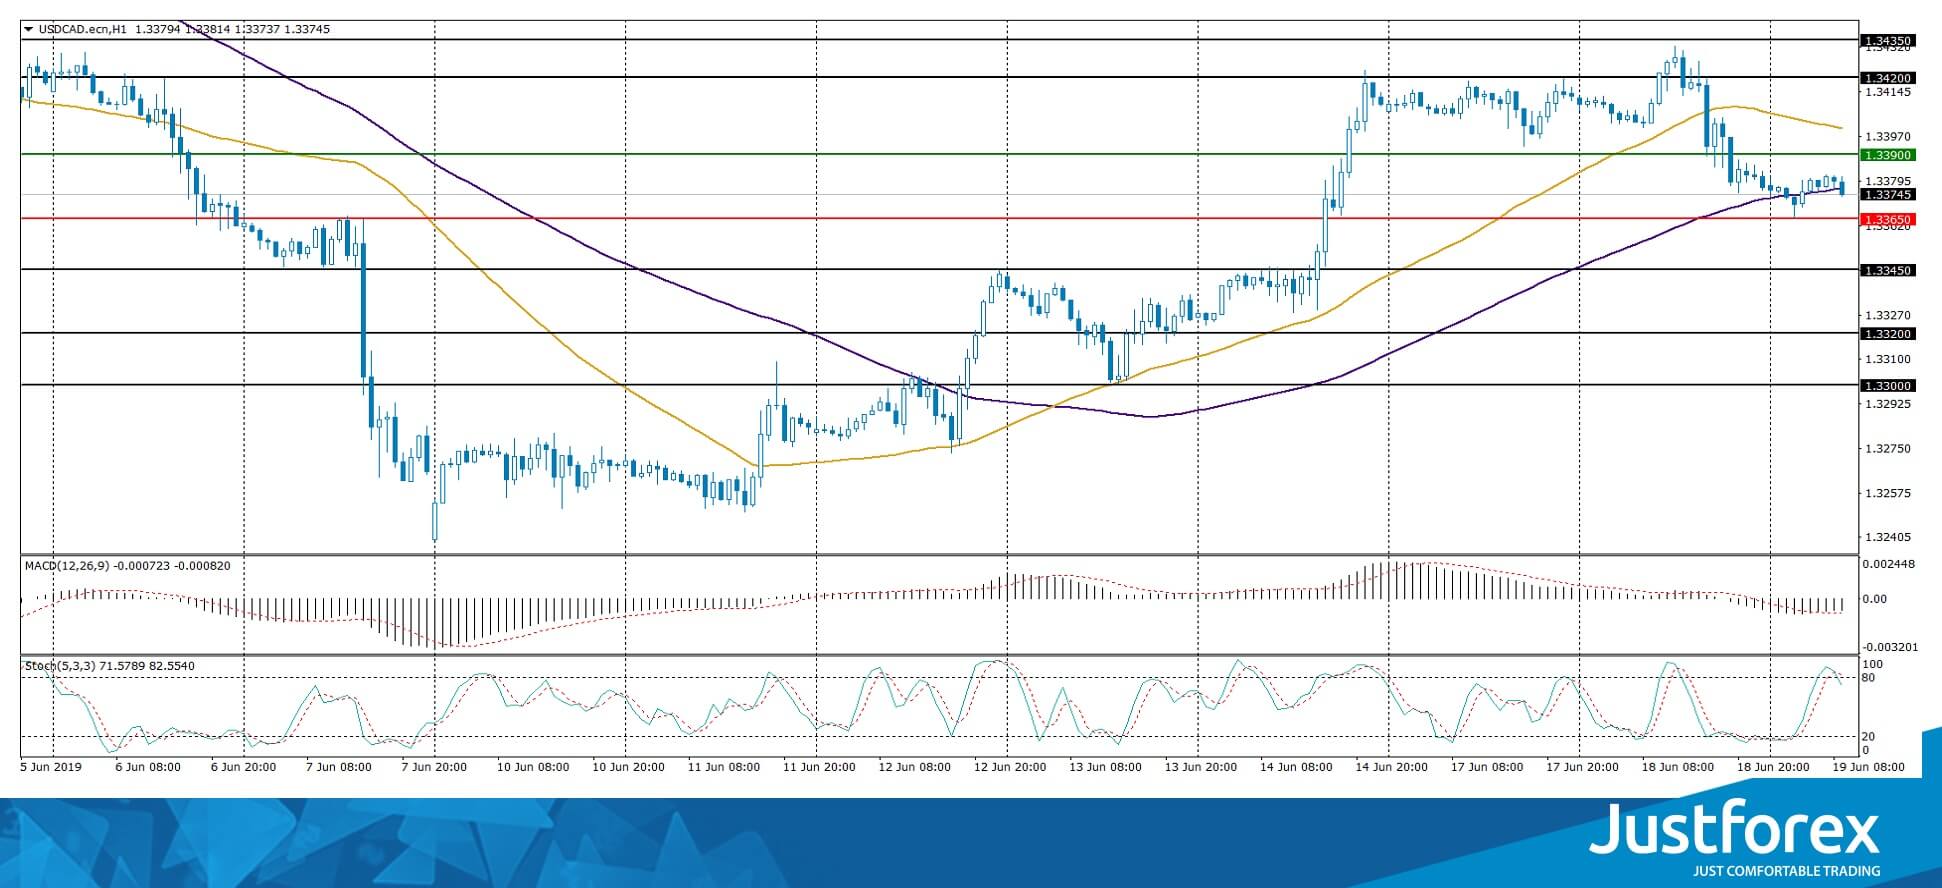
The indicators do not provide precise signals, the price has crossed 100 MA.
The MACD histogram is in the negative zone but above the signal line which gives a weak signal to sell USD/CAD.
The Stochastic Oscillator is in the overbought zone, the %K line is crossing the %D line. There are no signals at the moment.
Trading recommendations
Support levels: 1.33650, 1.33450, 1.33200
Resistance levels: 1.33900, 1.34200, 1.34350
If the price fixes below 1.33650, expect further correction towards 1.33450-1.33200.
Alternatively, the quotes can grow towards 1.34200-1.34400.
The USD/JPY currency pair
Technical indicators of the currency pair:
Prev Open: 108.523
Open: 108.446
% chg. over the last day: +0.26
Day’s range: 108.256 – 108.618
52 wk range: 104.97 – 114.56
The safe haven currencies keep moving sideways. The technical picture remains ambiguous. The quotes are testing the levels at 108.200 and 108.450. The market participants are waiting for the Federal Reserve to announce a key interest rate. Keep an eye on US Treasury bonds` yield. Open positions from the key levels.
During the Asian session, Japan published mixed reports on the trading balance.
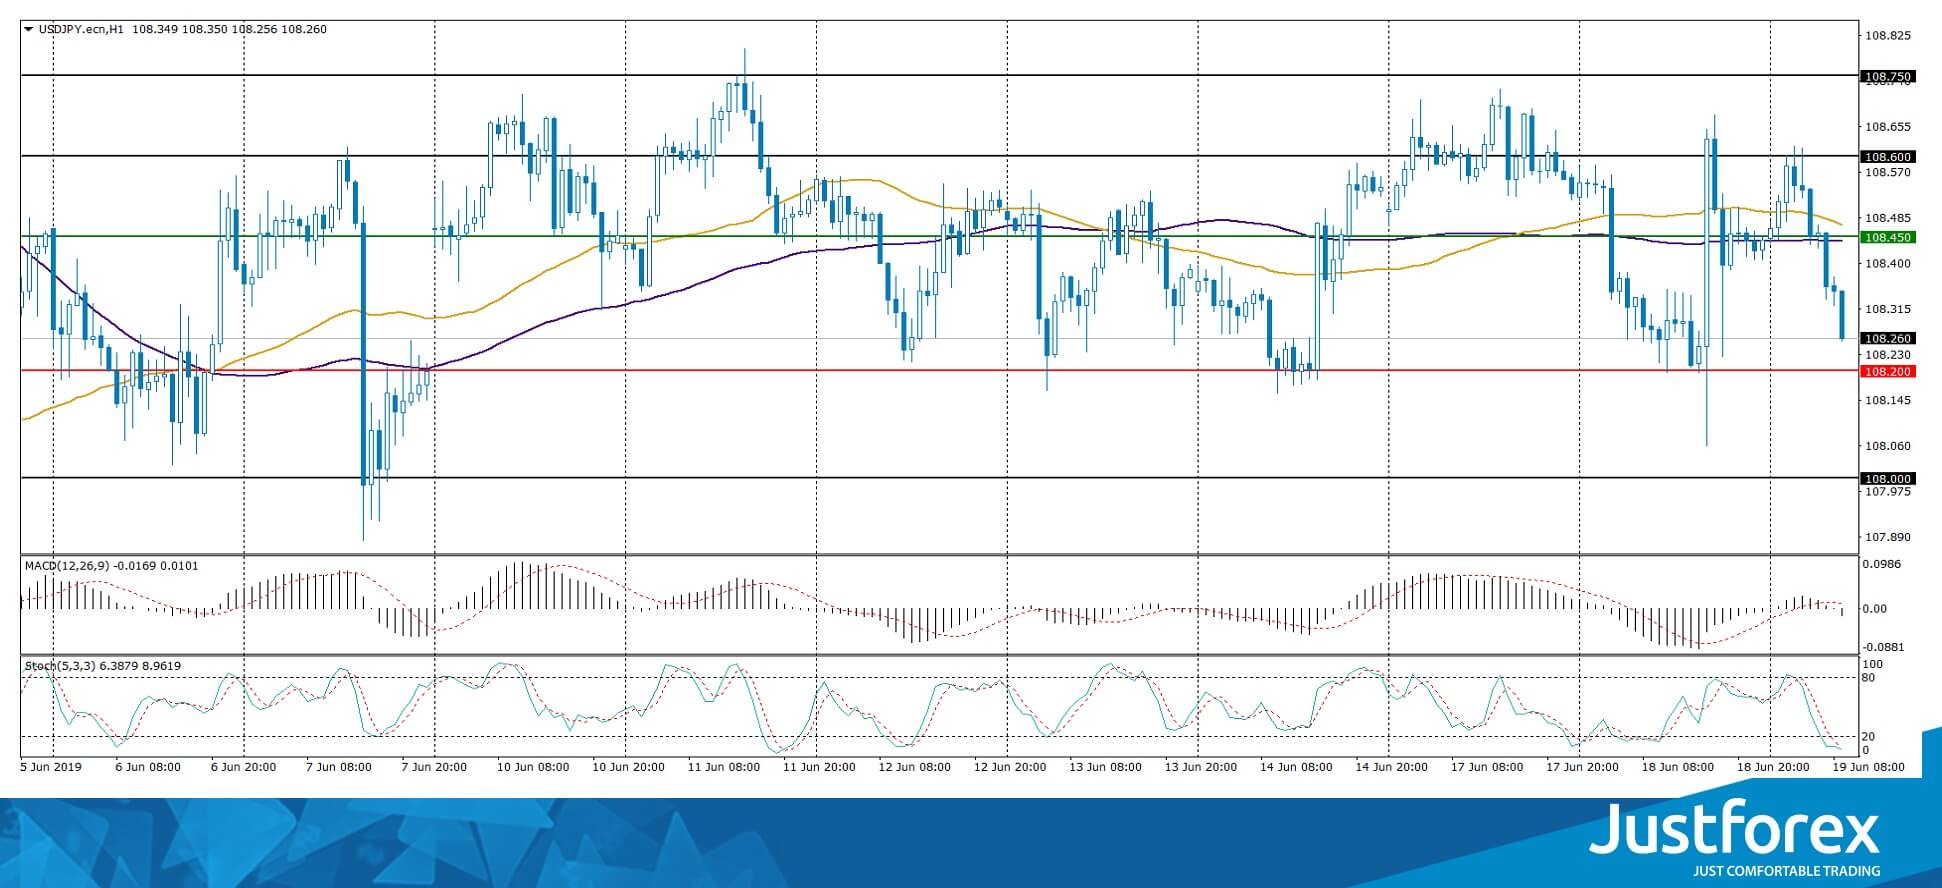
The indicators do not provide precise signals, 50 MA is crossing 100 MA.
The MACD histogram is close to 0.
The Stochastic Oscillator is in the oversold zone, the %K line is below the %D line which gives a weak signal to sell USD/JPY.
Trading recommendations
Support levels: 108.200, 108.000, 107.850
Resistance levels: 108.450, 108.600, 108.750
If the price fixes below 108.200, expect a descend towards 108.000-107.850.
Alternatively, the quotes can grow towards 108.600-108.750.