Currency pair EUR/USD
The EUR/USD broke the support trend line (dotted blue). A break below the previous bottom (green line) indicates that wave 2 (purple) has most likely been completed. A bullish bounce at the support level could extend the correction within wave 2.

The EUR/USD is probably building an ABC (green) zigzag correction unless price manages to break the support and 127.2% Fibonacci target. In that case the wave formation is probably a 123 rather than an ABC (green) within larger waves 3 of the 4 hour chart.

Currency pair GBP/USD
The GBP/USD showed a bearish breakout below support (dotted blue), which could see price start a wave 3 (blue/green). Price needs to reach the 161.8% Fibonacci target to confirm a wave 3 (blue).

The GBP/USD completed an ABC (orange) zigzag correction and broke below the support trend line (dotted green). There could be 5 wave (orange) within wave 3 (blue) if price reaches beyond the 138.2% Fibonacci target.

Currency pair USD/JPY
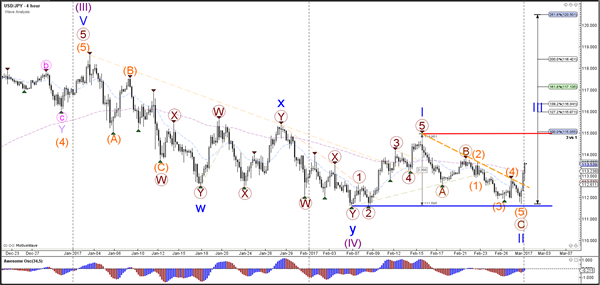
The USD/JPY challenged the bottom of wave 1 (blue line) and invalidation point of the wave structure but did not break below it. The wave 1-2 (blue) therefore is still valid. Price has broken above the resistance (orange line), which could indicate that the bearish correction has been completed.

The USD/JPY has broken above the resistance (orange line), which could indicate that the bearish correction has been completed.

