
The EUR/USD currency pair
Technical indicators of the currency pair:
Prev Open: 1.12299
Open: 1.12213
% chg. over the last day: -0.03
Day’s range: 1.12185 – 1.12416
52 wk range: 1.1111 – 1.2009
EUR/USD keeps consolidating around 1.12150-1.12400. The technical picture is ambiguous, the market participants wait for additional drivers. The US/China trading conflict remains in the spotlight. Beijing had fired back with additional fees, totaling around 60 billion USD annually. Keep an eye on this issue. The quotes have good prospects for growth, open the positions from these issues.
The Economic News Feed for 14.05.2019:
ZEW Economic Mood Index (EU) – 12:00 (GMT+3:00);
Industrial Production Volume (EU) – 12:00 (GMT+3:00);
Import/Export Price Index (US) – 15:30 (GMT+3:00);
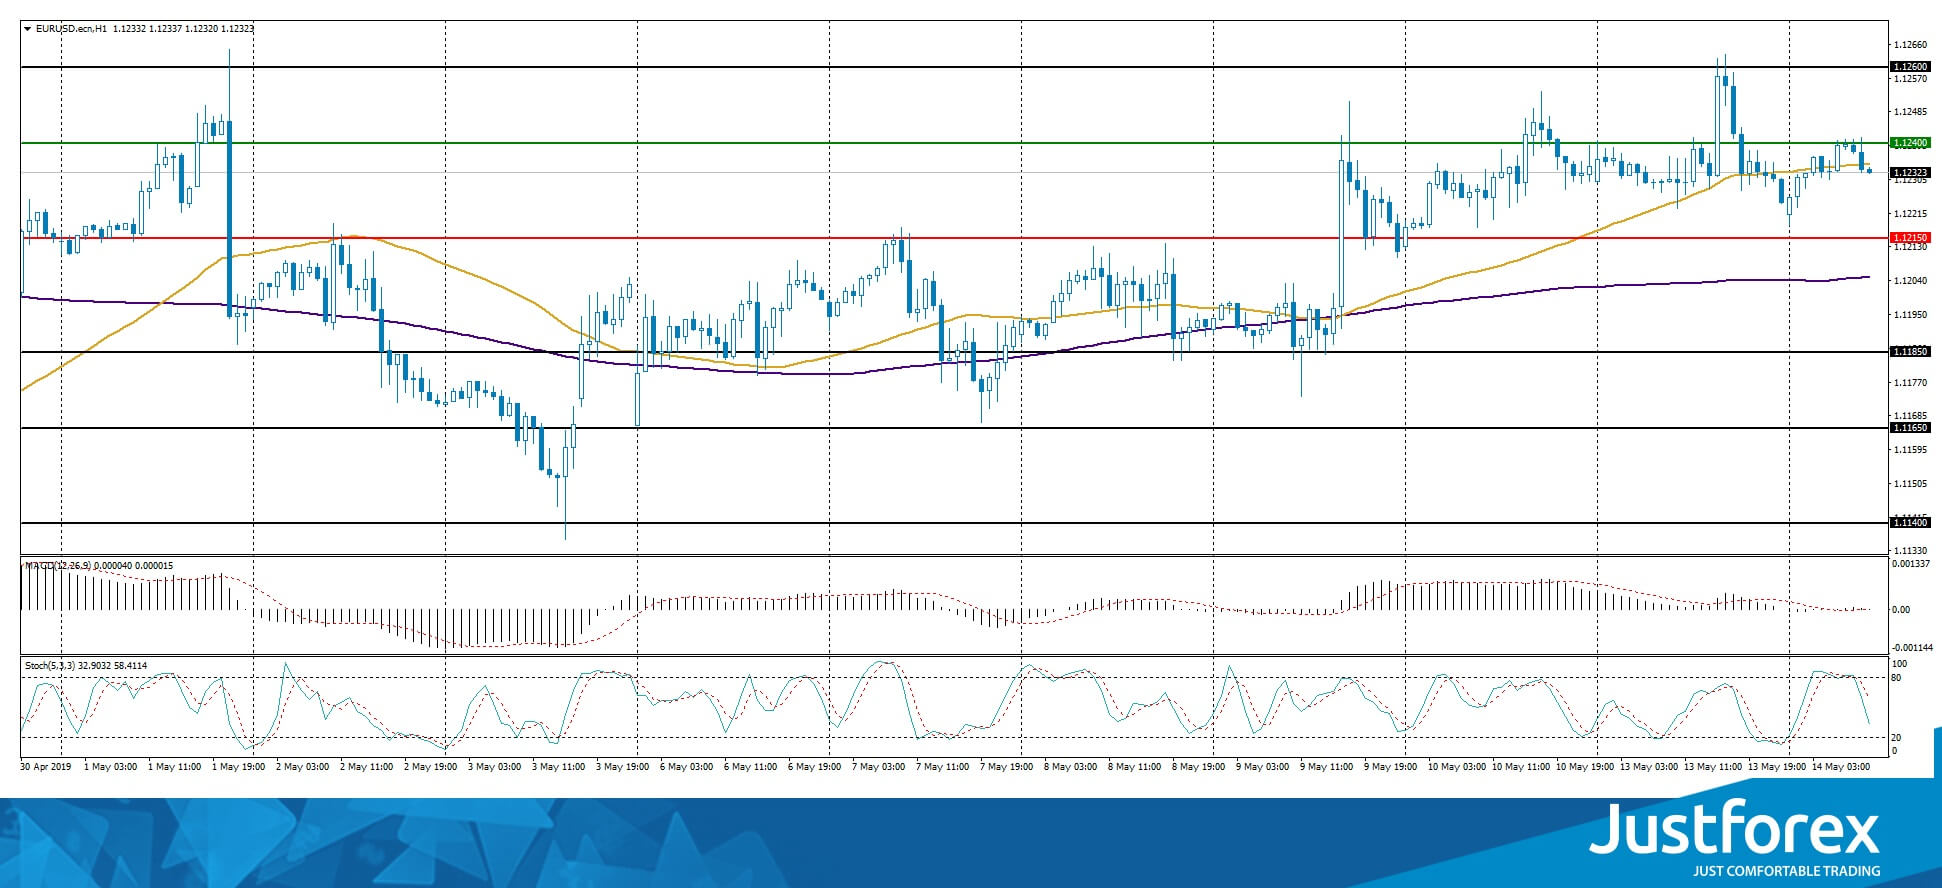
The indicators do not provide precise signals, the price has crossed 50 MA.
The MACD histogram is close to 0.
The Stochastic Oscillator is in the neutral zone, the %K line is below the %D line which points to the bearish mood.
Trading recommendations
Support levels: 1.12150, 1.11850, 1.11650
Resistance levels: 1.12400, 1.12600
If the price fixes above 1.12400, the quotes will grow toward 1.12600-1.12800.
Alternatively, the quotes can descend toward 1.11900-1.11700.
The GBP/USD currency pair
Technical indicators of the currency pair:
Prev Open: 1.29926
Open: 1.29926
% chg. over the last day: -0.33
Day’s range: 1.29346 – 1.29699
52 wk range: 1.2438 – 1.3631
GBP/USD started to descend and updated the local minimums. GBP remains under pressure due to Brexit. The market participants are worried tha the ruling and the opposing parties won’t be able to reach an agreement. The quotes are testing 1.29400 with 1.29800 acting as a mirror resistance. There are prospects for further descend. You should open positions from the key levels.’
At 11:30 (GMT+3:00) the UK will publish a labour market report.
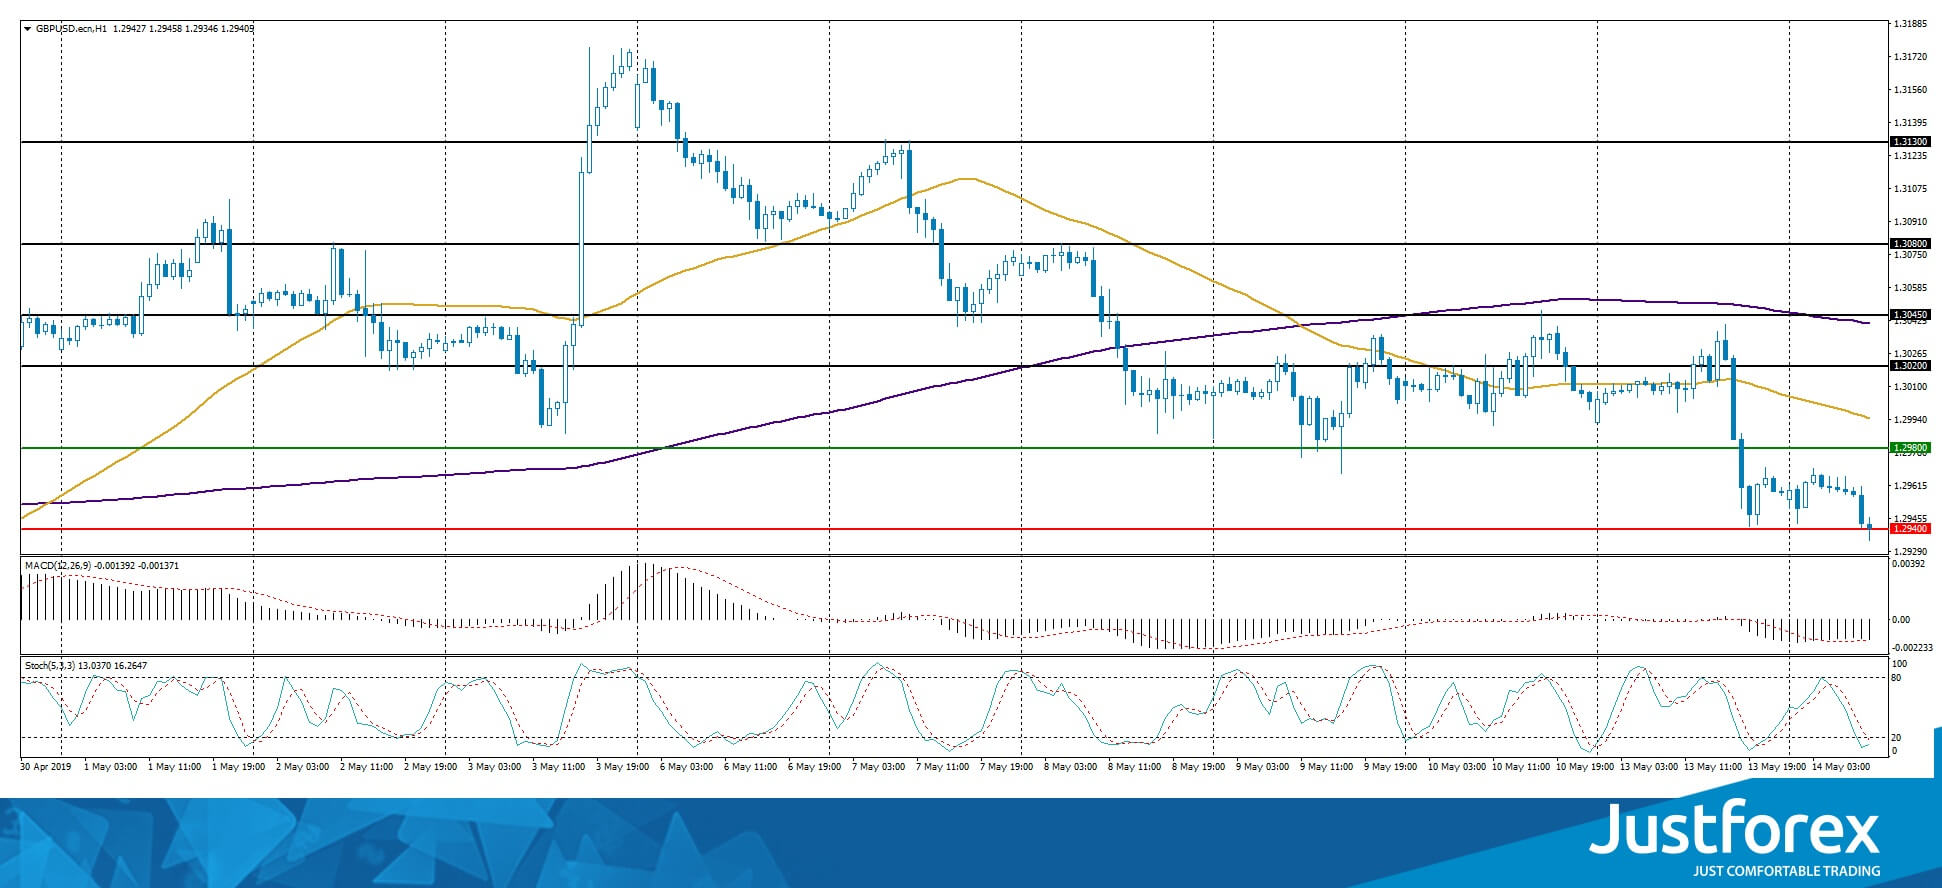
The price fixed below 50 MA and 200 MA which points to the power of the sellers.
The MACD histogram is in the negative zone and keeps falling which recommends selling GBP/USD.
The Stochastic Oscillator is in the oversold zone, the %K line is crossing the %D line. There are no signals at the moment.
Trading recommendations
Support levels: 1.29400, 1.29000
Resistance levels: 1.29800, 1.30200, 1.30450
If the price fixes below 1.29400, expect further descend toward 1.29000.
Alternatively, the quotes can recover toward 1.30200-1.30450.
The USD/CAD currency pair
Technical indicators of the currency pair:
Prev Open: 1.34208
Open: 1.34716
% chg. over the last day: +0.28
Day’s range: 1.34593 – 1.34874
52 wk range: 1.2727 – 1.3664
USD/CAD started to grow. The instrument updated the local maximums. The qutoes are consolidating around 1.34550-1.34850. The market participants are waiting for additional drivers. You should keep an eye on the oil quotes and open positions from the key levels.
The Economic News Feed for 14.05.2019 is calm.
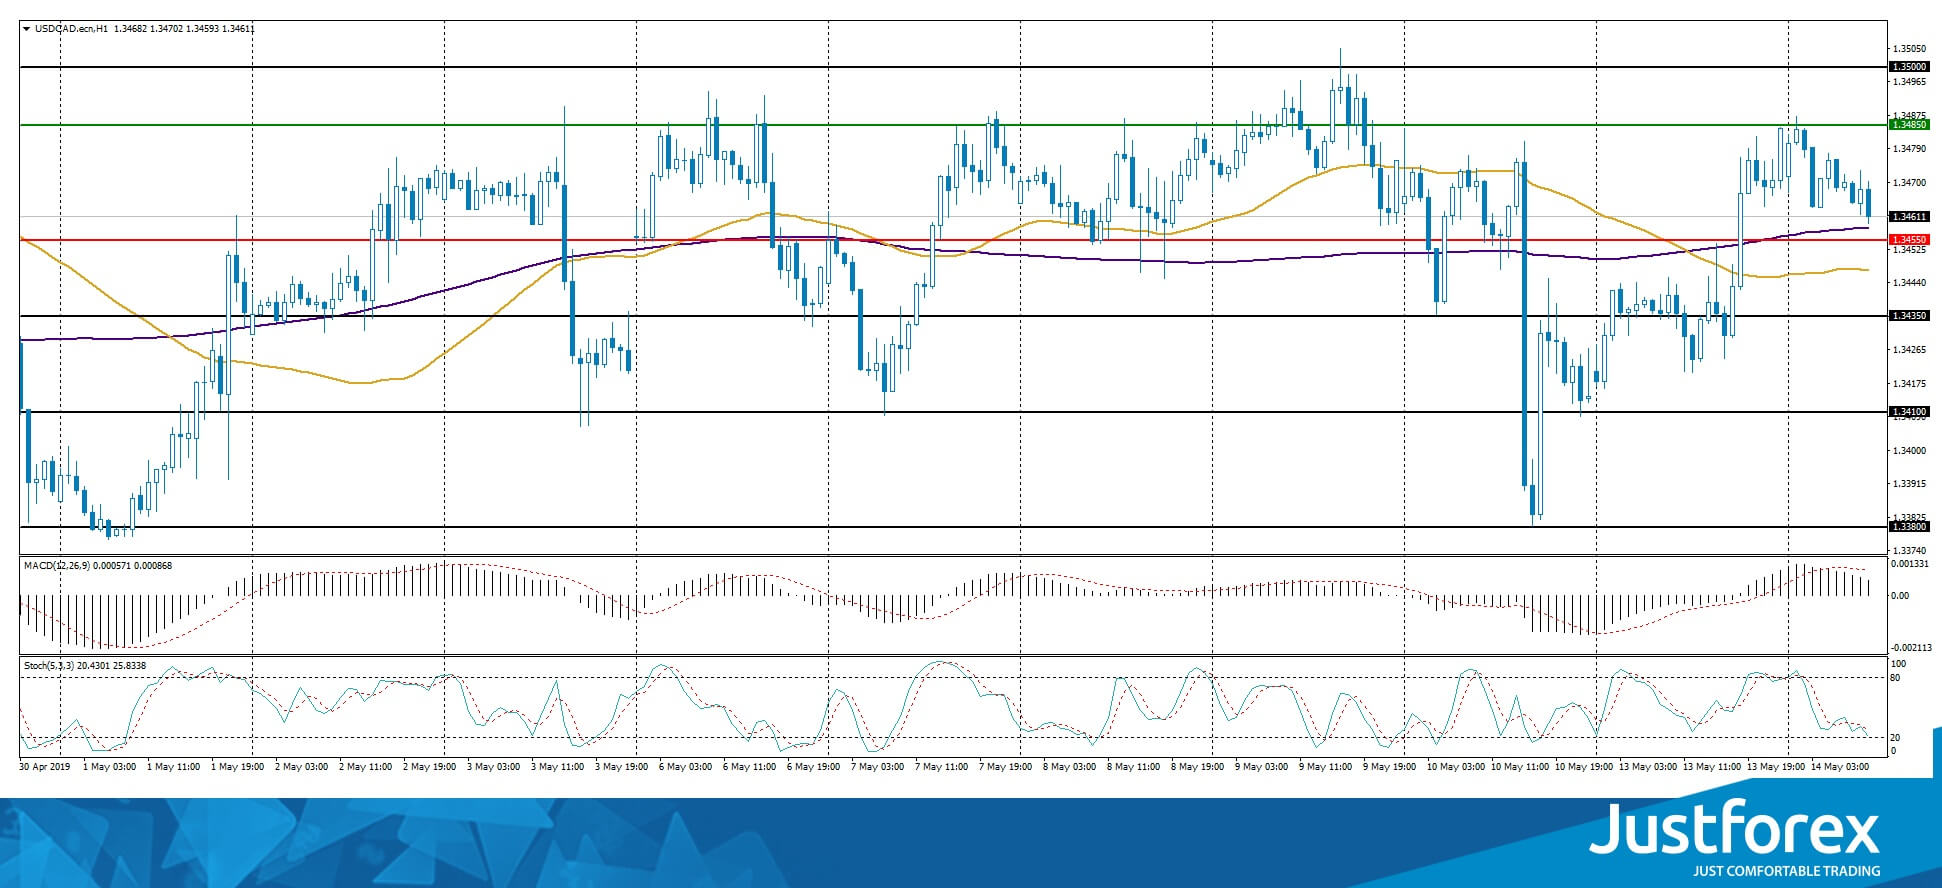
The indicators do not provide precise signals, the price is consolidating around 200 MA.
The MACD histogram is in the positive zone but below the signal line which gives a weak signal to buy USD/CAD.
The Stochastic Oscillator is in the neutral zone, the %K line is above the %D line which points to the bullish mood.
Trading recommendations
Support levels: 1.34550, 1.34350, 1.34100
Resistance levels: 1.34850, 1.35000
If the price fixes above 1.34850 expect further growth toward 1.35250-1.35400.
Alternatively, the quotes are descending toward 1.34300-1.34100.
The USD/JPY currency pair
Technical indicators of the currency pair:
Prev Open: 109.760
Open: 109.287
% chg. over the last day: -0.44
Day’s range: 109.145 – 109.772
52 wk range: 104.97 – 114.56
USD/JPY started recovering after a long fall. Right now the quotes are consolidating. The local support and resistance levels are 109.350-109.750. The demand for the safe assets remains high due to the trading conflict escalation between the US and China. Keep an eye on the US Treasury bonds and open positions from the key levels.
The Economic News Feed for 14.05.2019 is calm.
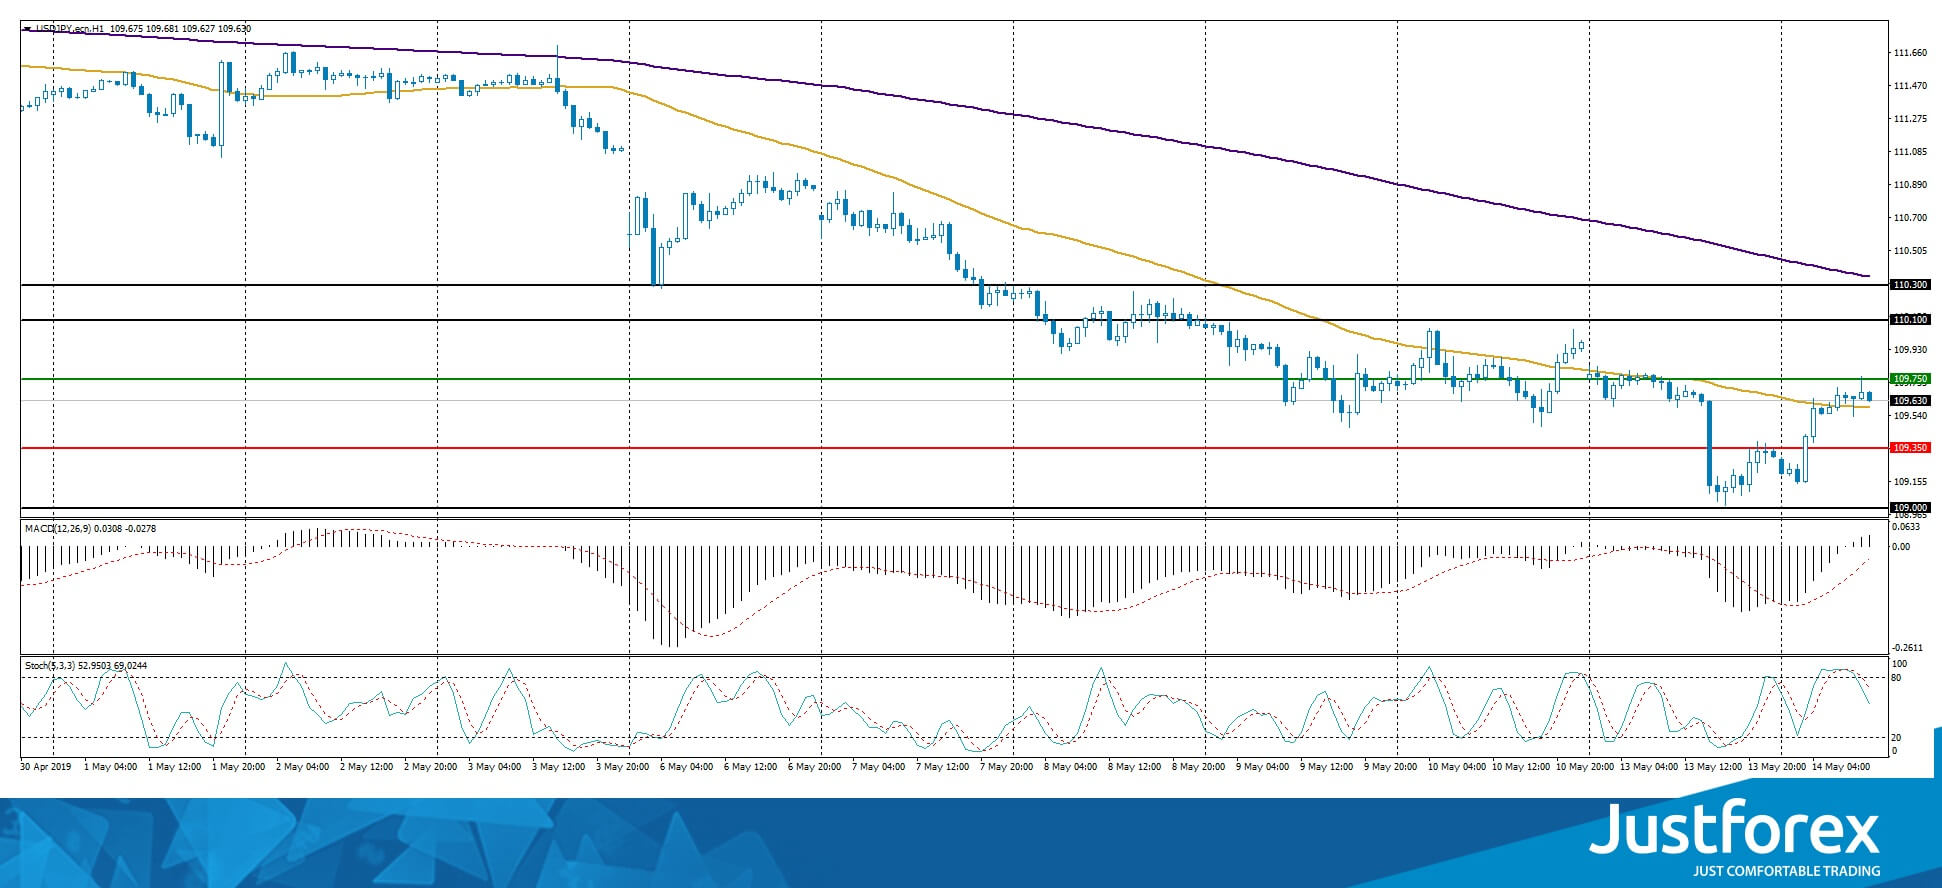
The indicators do not provide precise signals, the price has crossed 50 MA/
The MACD histogram moved into a positive zone which points towards a correction.
The Stochastic Oscillator is in the neutral zone, the %K line is below the %D line which recommends selling USD/JPY.
Trading recommendations
Support levels: 109.350, 109.000
Resistance levels: 109.750, 110.100, 110.300
If the price fixes above 109.750, expect a correction toward 110.100-110.300.
Alternatively, the quotes can fall toward 109.000.