US stocks were mixed yesterday as traders continued to focus on ongoing trade issues. This week, Donald Trump announced that fresh tariffs on Chinese goods would come into effect on Friday, upended more than four months of talks that have been happening between United States and China. According to reports, Trump has been frustrated that the deal currently proposed will not go far enough. He has also been frustrated by China’s changing statements as the talks have gone on. He has been emboldened by the Q1 GDP numbers in which the US economy rose by 3.2%. Today, in response to trade issues and Chinese inflation data, Chinese stocks declined sharply, with the A50 index declining by 347 points.
The price of crude oil remained relatively unchanged after the energy department released the crude oil inventory numbers. In the past week, inventories declined by 3.93 million barrels. This was a surprise because investors were expecting the inventories to rise by more than 1 million barrels. In the previous week, inventories rose by more than 9 million barrels. On Tuesday, data from API showed that inventories rose by 2.8 million barrels.
Today, traders will focus on trade data from the United States and a statement by Fed Chair, Jerome Powell. The data will be important because it will show whether Trump’s trade war is working. In April, numbers showed that exports rose to $209.7 billion while imports rose to $259 billion. If the trade deficit narrows, Trump will see it as a win. The initial jobless claims are expected to improve by 215K while the continuing jobless claims are expected to decline to 1,670K. The PPI is expected to increase by an annualized rate of 2.3%, which will be higher than the previous 2.2%.
EUR/USD
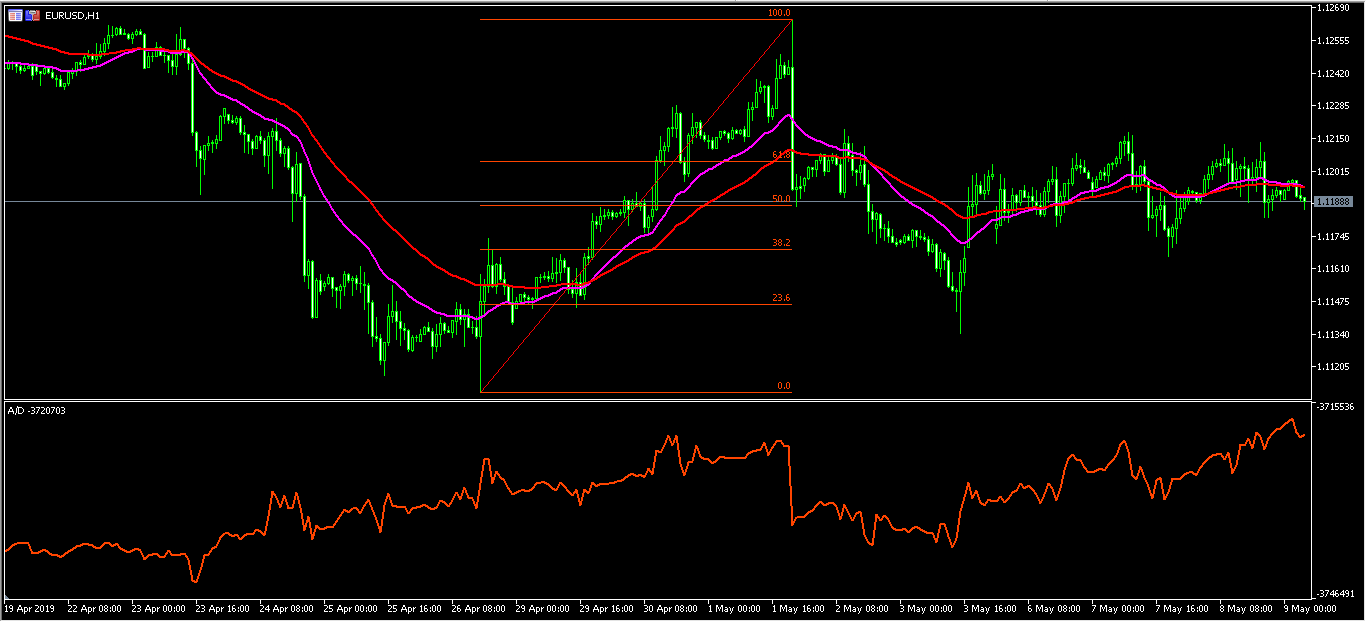
The EUR/USD pair was little moved in the Asian session. It is trading at the 1.1190 level, which is along the 50% Fibonacci Retracement level on the hourly chart. This price is slightly below the 25-day and 50-day moving averages. The accumulation/distribution indicator too has moved higher. The pair will likely remain in this consolidation mode as traders wait for the CPI data from the US.
GBP/USD
This week, the GBP/USD pair has fallen sharply from a high of 1.3177 to a low of 1.2985. The decline has happened as investors continue to worry about Brexit. On the hourly chart, this price is slightly below the 50% Fibonacci Retracement level and along the middle line of the Bollinger Bands. The RSI has emerged slightly from the oversold level of 30 to the current 36. From here, the pair could decline to test the 23.6% Fibonacci level at 1.2940.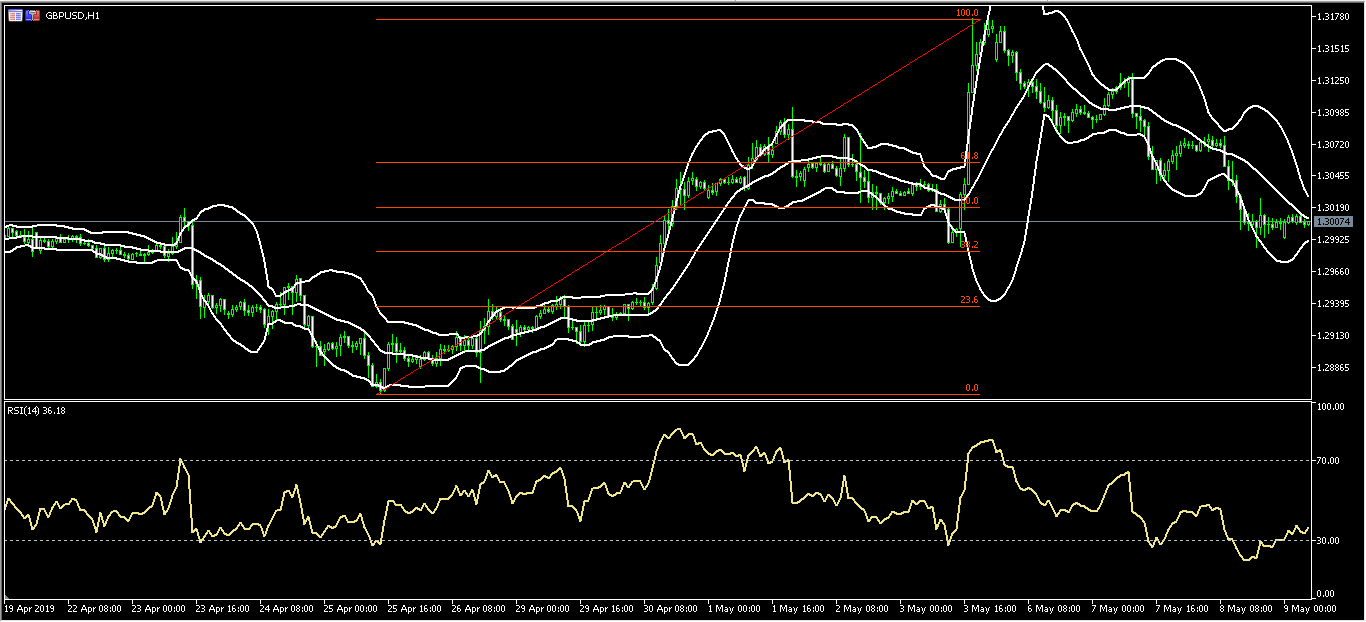
XBR/USD
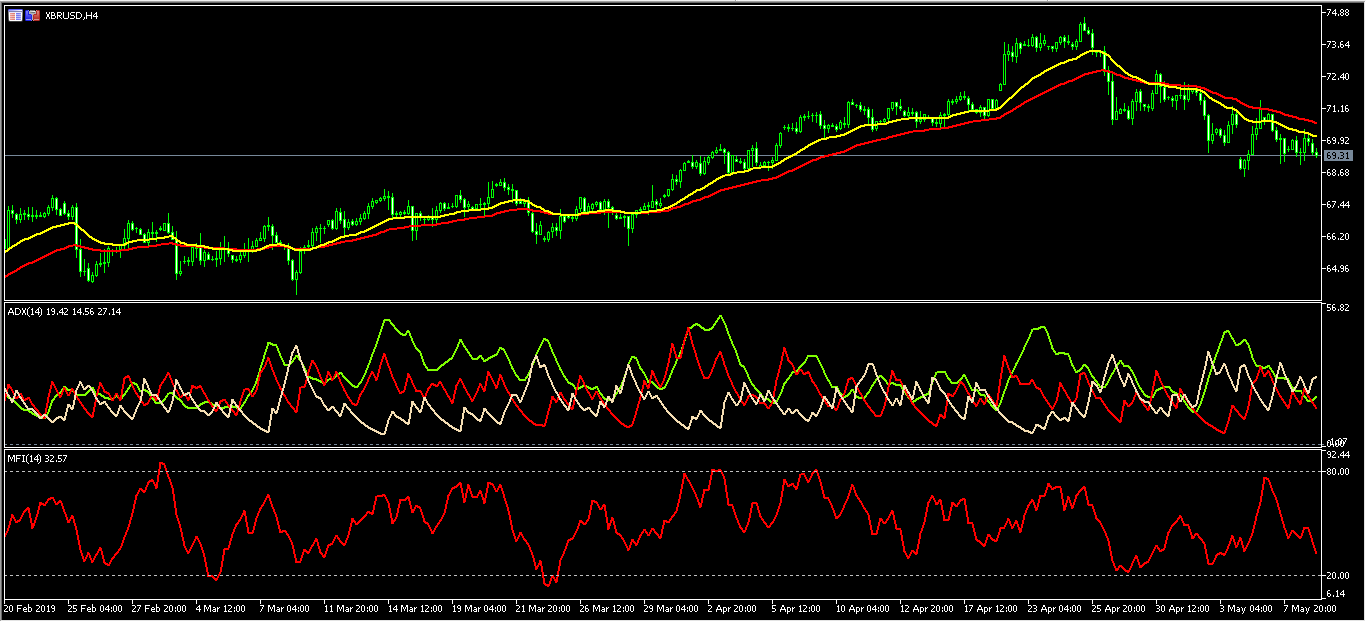
This month, the XBR/USD pair has been declining. It has declined from a high of 74.73 to a low of 68.50. On the four-hour chart, the price is currently below the 50-day and 25-day moving average. The Average Directional Index has declined from a high of 45 to the current 19. The money flow index too has declined sharply. It’s likely that the pair could drop for a while before resuming the upward trend.