
The EUR/USD currency pair
Technical indicators of the currency pair:
Prev Open: 1.12399
Open: 1.12567
% chg. over the last day: +0.12
Day’s range: 1.12429 – 1.12605
52 wk range: 1.1214 – 1.2557
Yesterday the trading on the majors was relatively calm. The financial markets in Australia, Hongkong and other major countries were closed due to the holidays. The USD index #DX closed the trading session with a slight descend. The pressure on USD was caused by the weak real estate market report from the US. Right now the EUR/USD quotes are consolidating at 1.12350-1.12600. The EUR has a tendency to descend further. You should open positions from the key levels.
Today the investors will evaluate the new real estate sales in US for March at 17:00 (GMT+3:00).
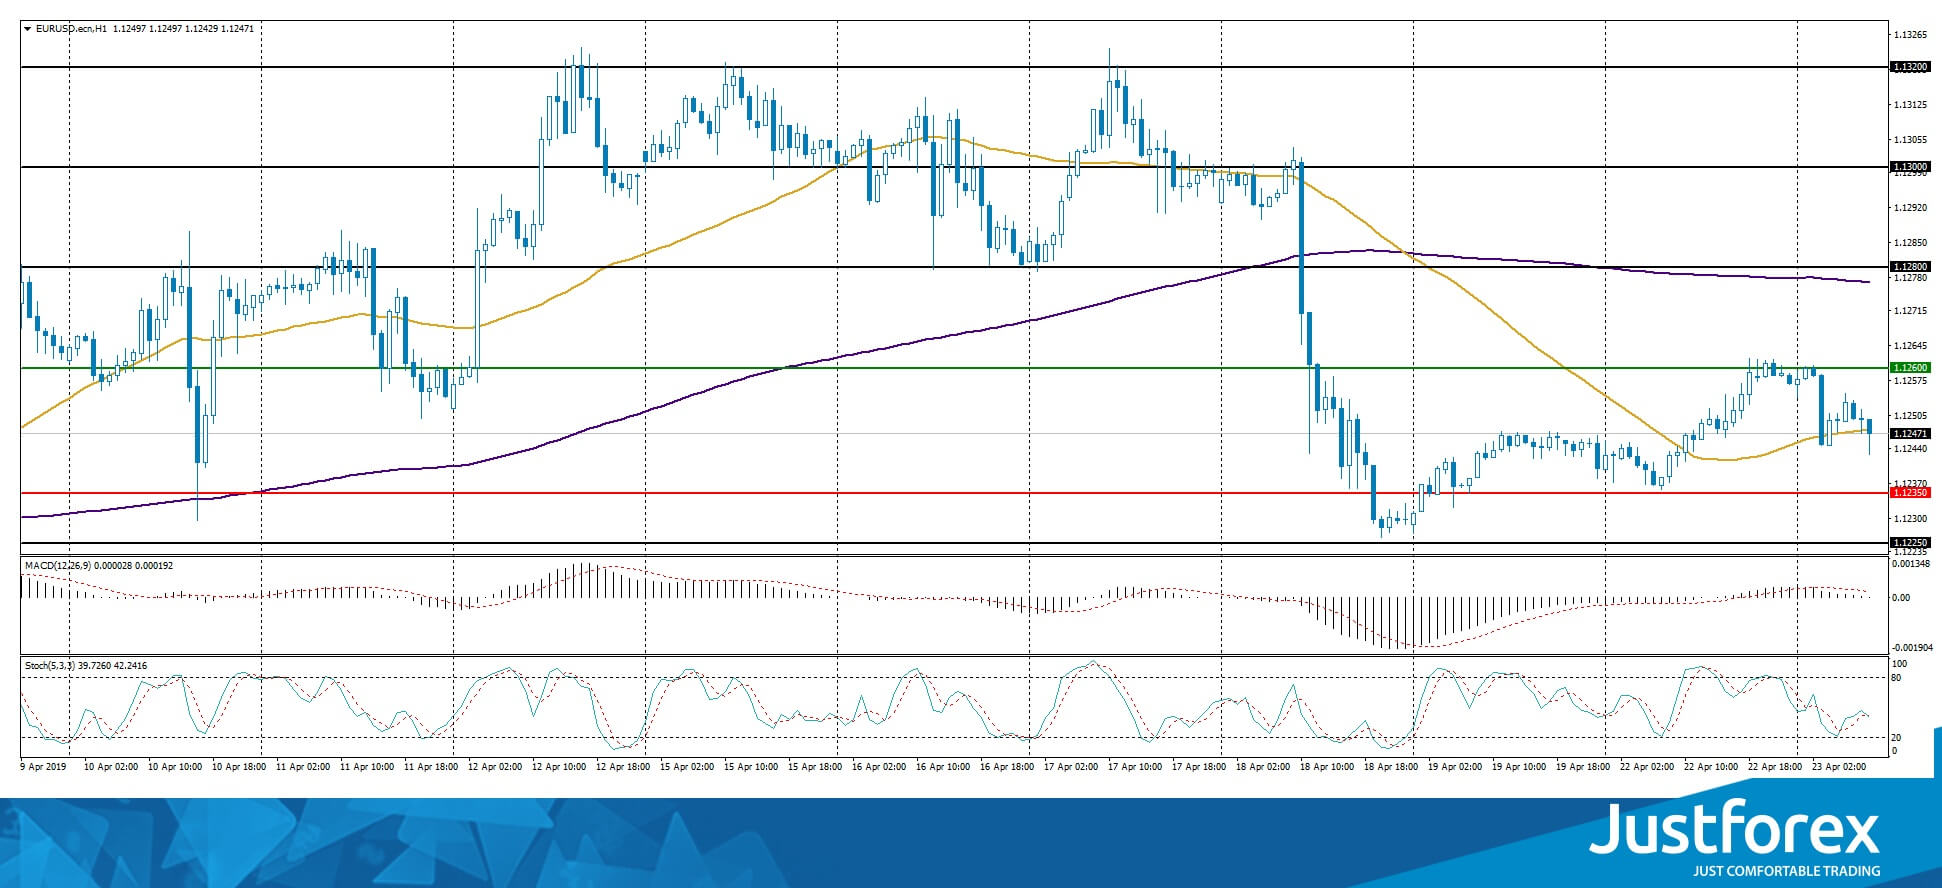
The indicators do not provide precise signals, the price has crossed 50 MA.
The MACD histogram is close to 0.
The Stochastic Oscillator is in the neutral zone, the %K line is crossing the %D line. There are no signals at the moment.
Trading recommendations
Support levels: 1.12350, 1.12000
Resistance levels: 1.12600, 1.12800, 1.13000
If the price fixes below 1.12350, expect further descend toward 1.12000.
Alternatively, the quotes can recover toward 1.12800-1.12900.
The GBP/USD currency pair
Technical indicators of the currency pair:
Prev Open: 1.29848
Open: 1.29812
% chg. over the last day: -0.09
Day’s range: 1.29749 – 1.29903
52 wk range: 1.2438 – 1.4378
GBP keeps its positions agains the USD. The technical picture remains ambiguous. The financial market participants are waiting for additional drivers. GBP/USD is testing the local support and resistance leves at 1.29750-1.30000. You should open positions from these levels. Expect the real estate from the US today and track the info regarding Brexit.
The Economic News Feed for 23.04.2019 is calm.
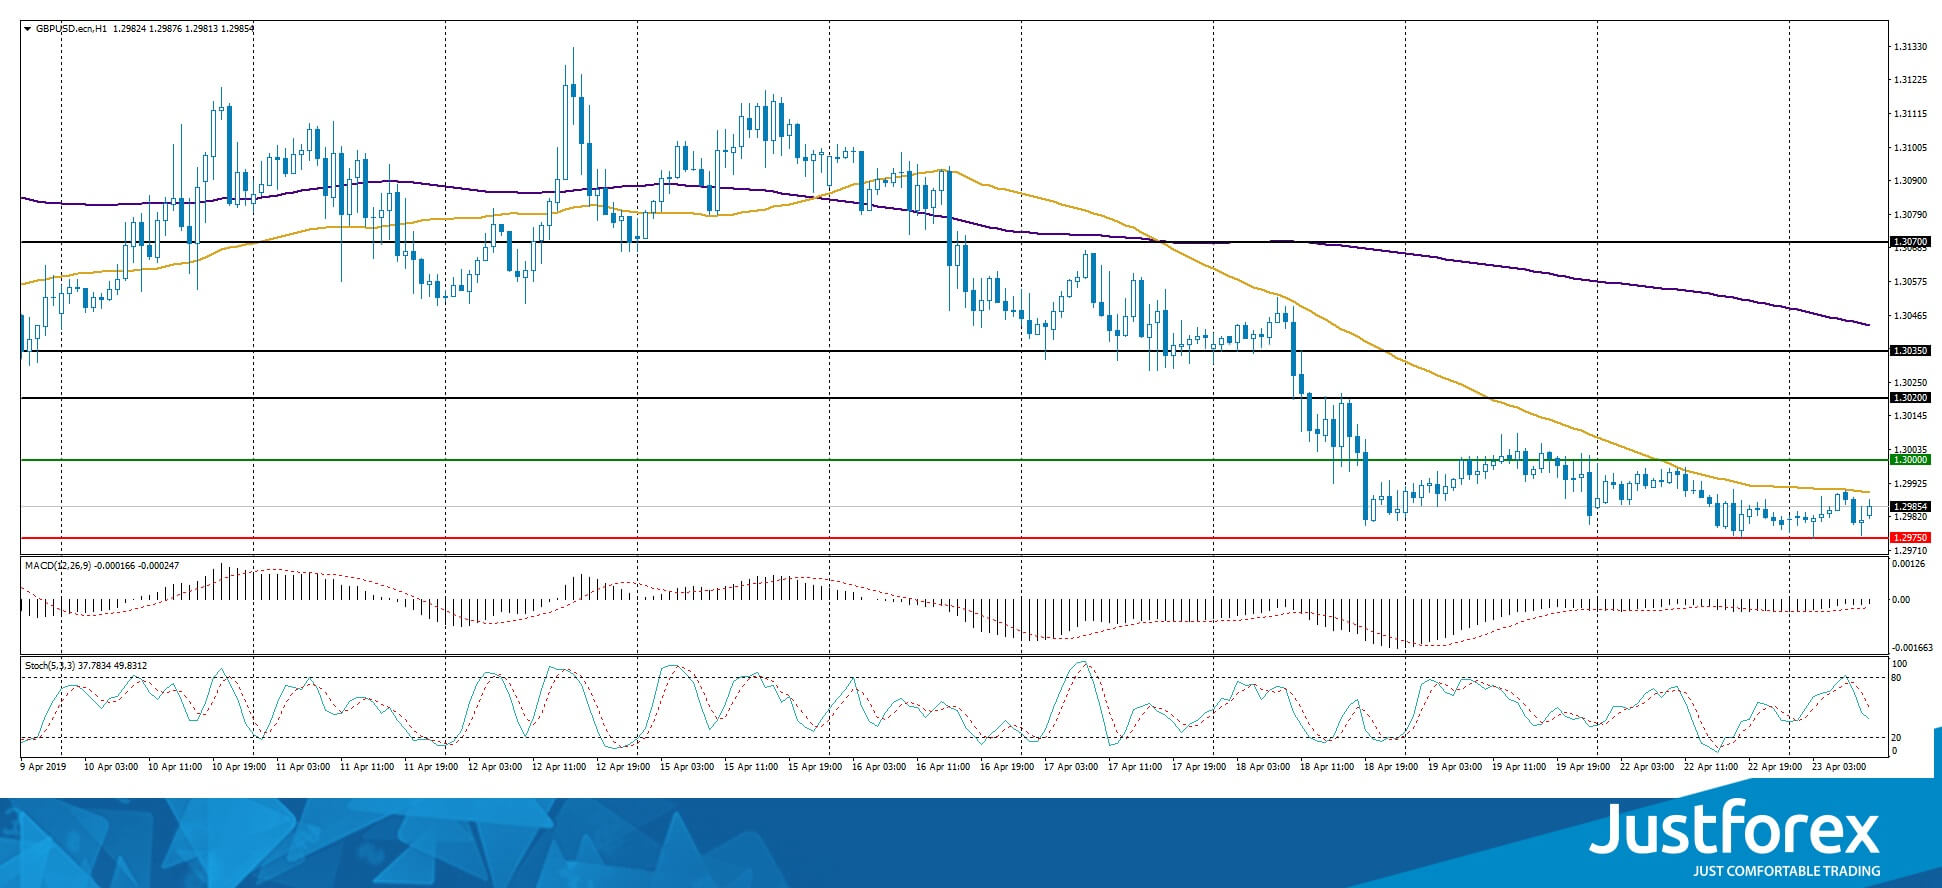
The price fixed below 50 MA and 200 MA which points to the power of the buyers.
The MACD histogram is in the negative zone but above the signal line which gives a weak signal to sell GBP/USD.
The Stochastic Oscillator is in the neutral zone, the %K line is below the %D line which points to the bearish mood.
Trading recommendations
Support levels: 1.29750, 1.29400, 1.29000
Resistance levels: 1.30000, 1.30200, 1.30350
If the price fixes below 1.29750, expect the quotes to fall toward 1.29500-1.29300.
Alternatively, the quotes can recover toward 1.30300-1.30500.
The USD/CAD currency pair
Technical indicators of the currency pair:
Prev Open: 1.33816
Open: 1.33499
% chg. over the last day: -0.27
Day’s range: 1.33433 – 1.33714
52 wk range: 1.2248 – 1.3664
The USD/CAD currency pair is moving sideways. There is no defined trend. The demand for CAD remains high due to a bullish oil market. The WTI futures are the highest they’ve been since October 2018. The key support and resistance levels are 1.33400 and 1.33700. The USD/CAD quotes have a tendency to descend. You should open positions from the key levels.
The Economic News Feed for 23.04.2019 is calm.
Wholesale Sales Report (CAD) – 15:30 (GMT+3:00);
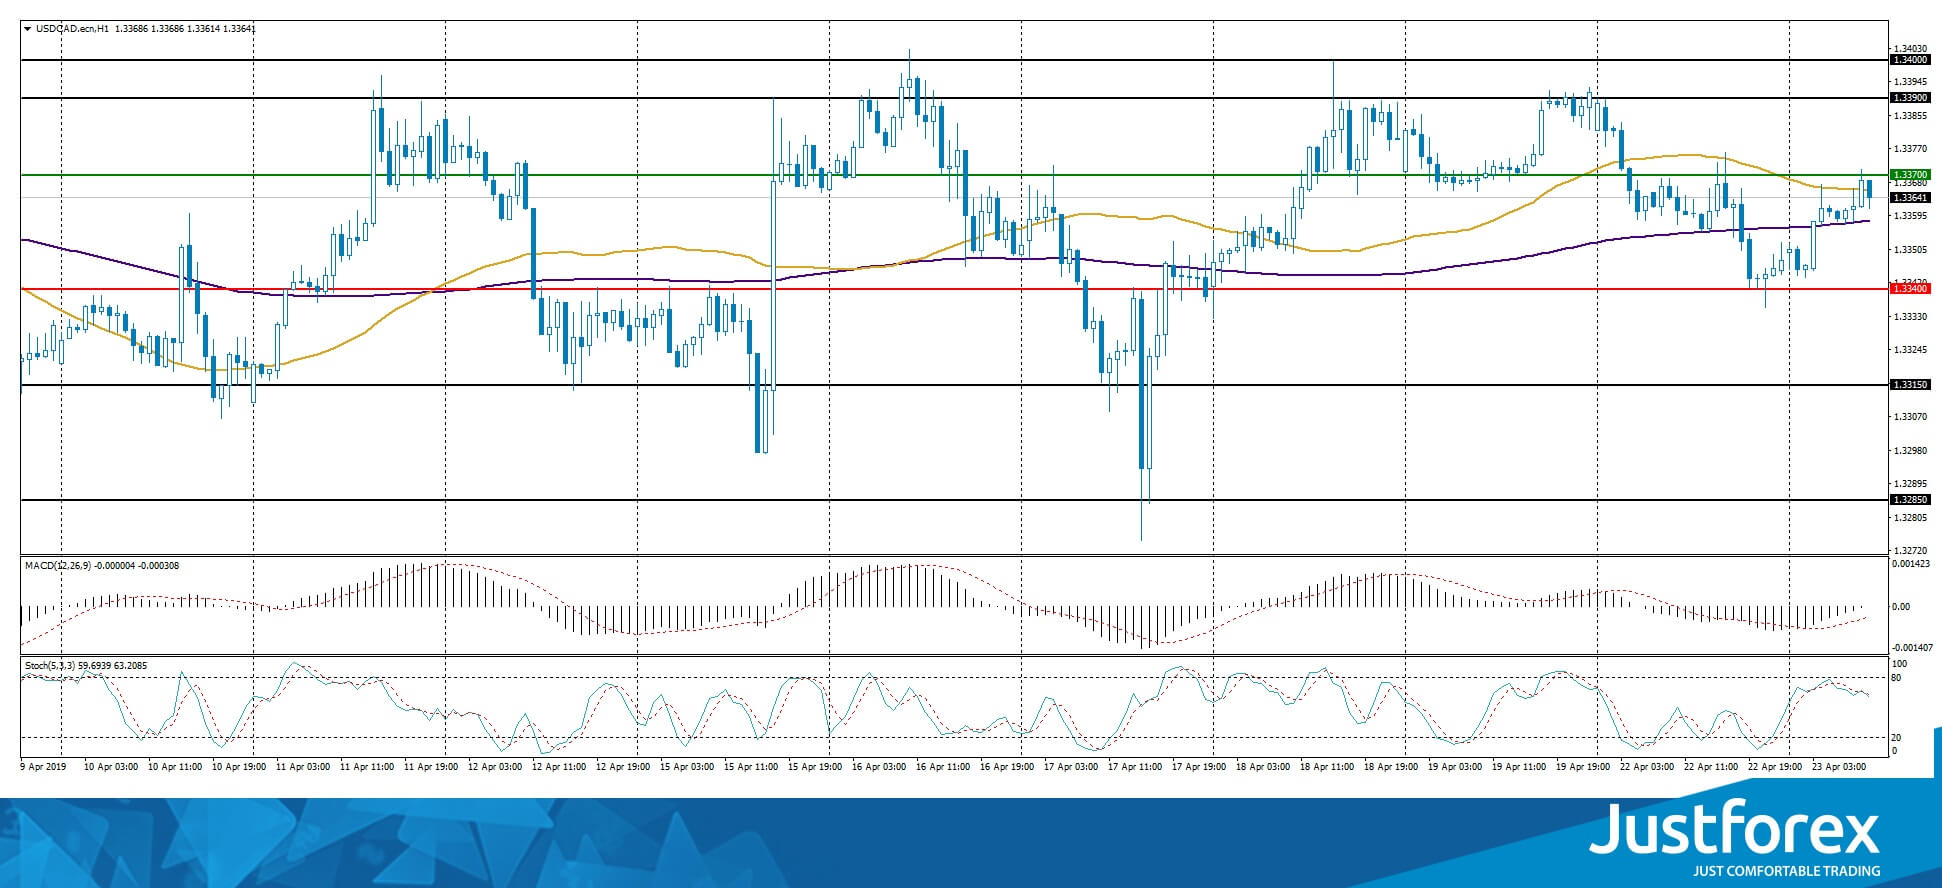
The indicators do not provide precise signals, the price has crossed 50 MA and 200 MA.
The MACD histogram is close to 0.
The Stochastic Oscillator is in the neutral zone, the %K line is crossing the %D line. There are no signals at the moment.
Trading recommendations
Support levels: 1.33400, 1.33150, 1.32850
Resistance levels: 1.33700, 1.34000
If the price fixes above 1.33400, expect the quotes to fall towards 1.33000.
Alternatively, the quotes can grow toward 1.34000-1.34200.
The USD/JPY currency pair
Technical indicators of the currency pair:
Prev Open: 111.863
Open: 111.919
% chg. over the last day: +0.02
Day’s range: 111.652 – 111.976
52 wk range: 104.56 – 114.56
USD/JPY remains ambiguous. The technical instrument is moving sideways, the key support and resistance levels are 111.650 and 112.000. The USD/JPY quotes have a tendency to descend. Keep an eye on the real estate market and the US Treasury bonds yield. Open the positions from the key levels.
The Economic News Feed for 23.04.2019 is calm.
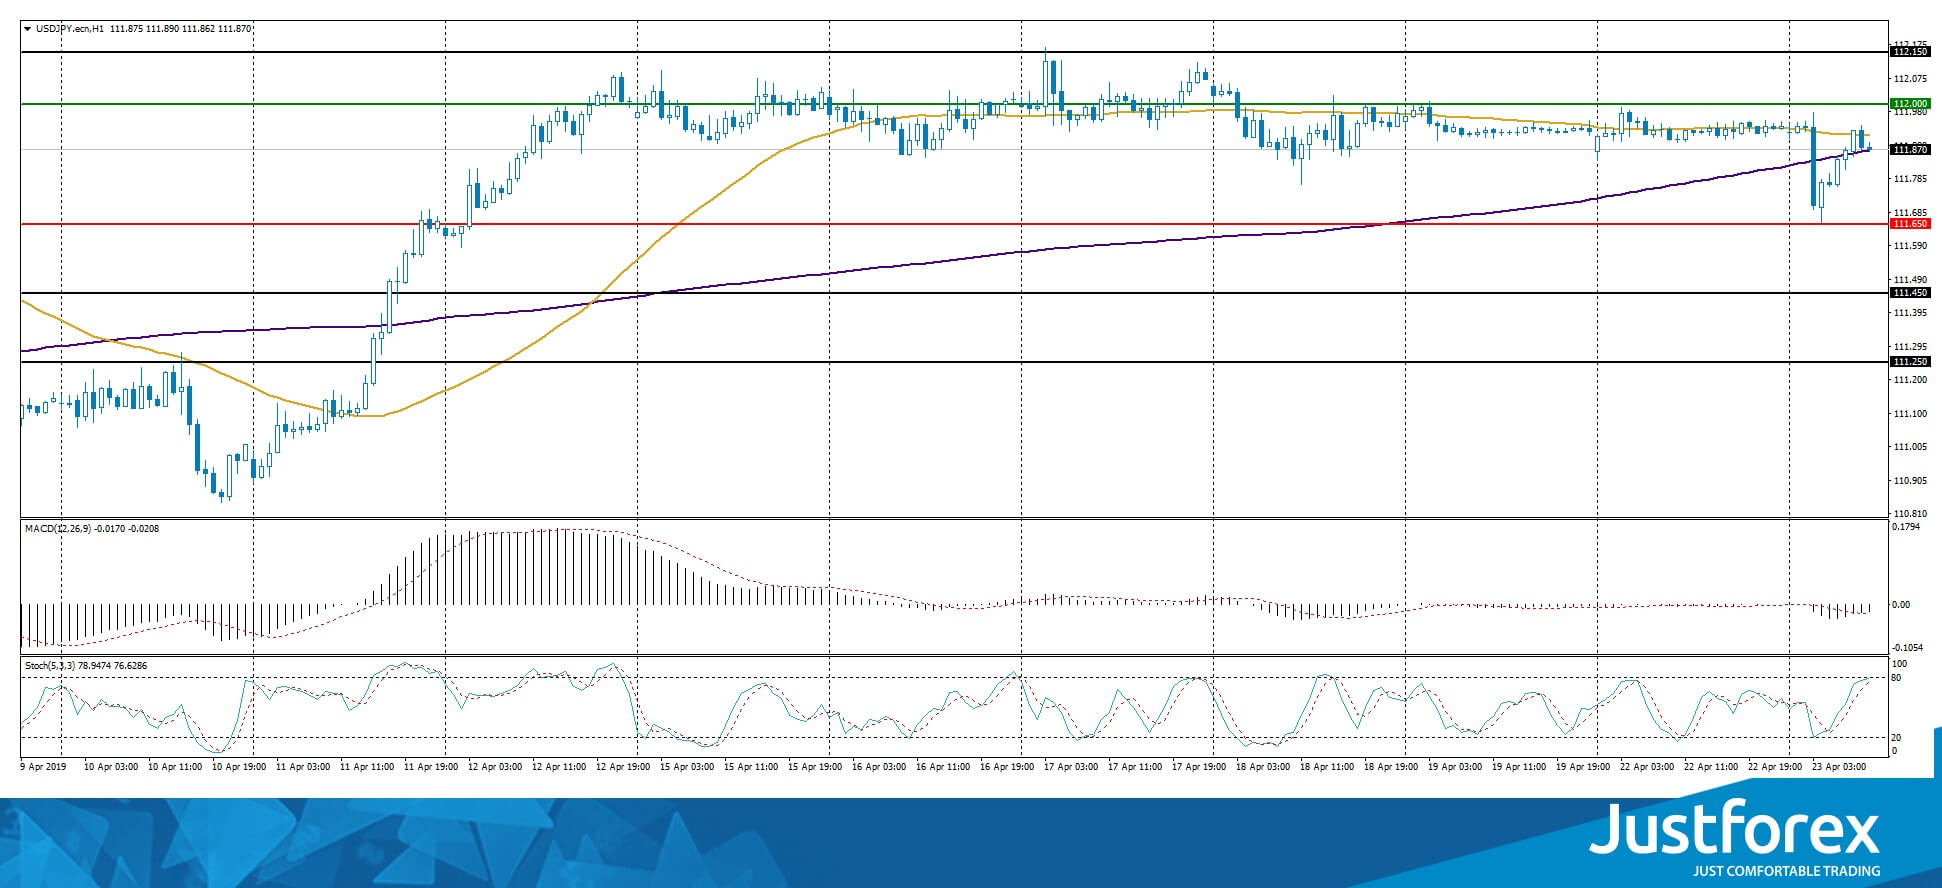
The indicators do not provide precise signals, the price has crossed 50 MA and 200 MA.
The MACD histogram is in the negative zone but above the signal line which gives a weak signal to sell USD/JPY.
The Stochastic Oscillator is in the neutral zone, the %K line is above the %D line which points towards a bullish mood.
Trading recommendations
Support levels: 111.650, 111.450, 111.250
Resistance levels: 112.000, 112.150, 112.500
If the price fixes above 111.650, expect further descend towards 111.400-111.200.
Alternatively, the quotes can grow towards 112.300-112.500.