
The EUR/USD currency pair
Technical indicators of the currency pair:
Prev Open: 1.13158
Open: 1.12696
% chg. over the last day: -0.34
Day’s range: 1.12469 – 1.12772
52 wk range: 1.1214 – 1.2557
EUR/USD started to descend again. During the last two days of trading, the quotes fell by 60 points and set the new minimums. This is mostly caused by technical factors and right now the quotes are consolidating around 1.12500-1.12800. You should open positions from these levels.
The Economic News Feed for 27.03.2019:
Trading Balance Report (US) – 14:30 (GMT+2:00);
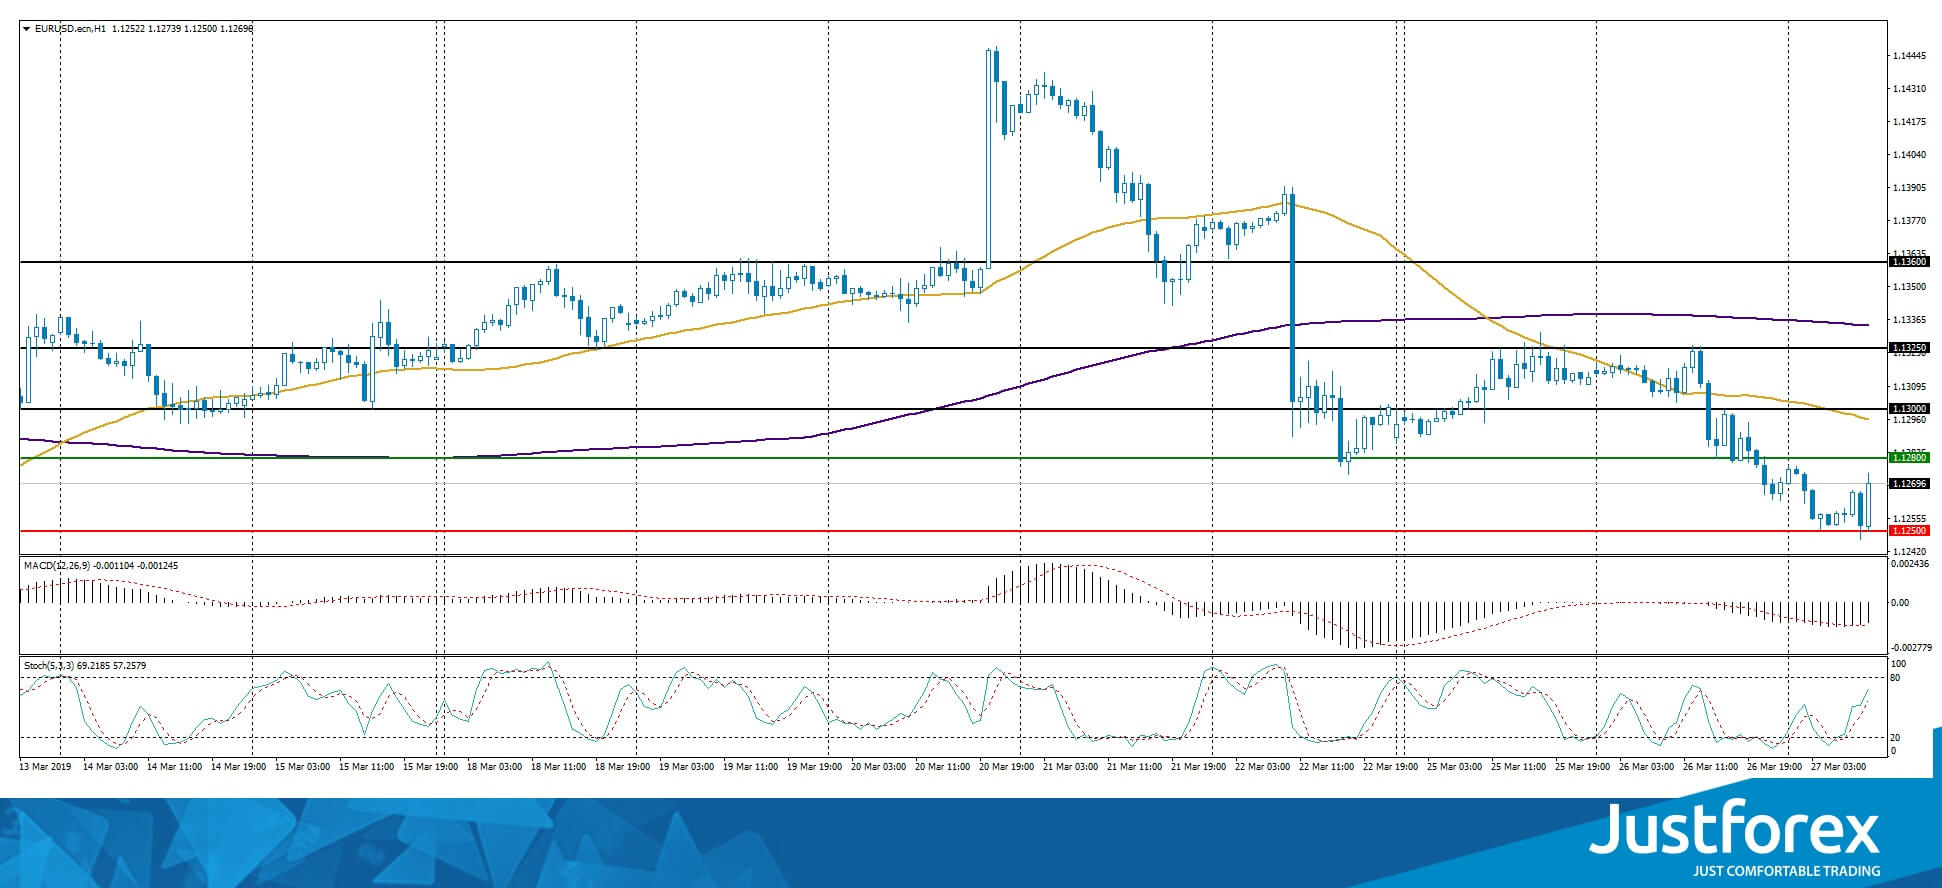
The price fixed below 50 MA and 200 MA which points to the power of the sellers.
The MACD histogram is in the negative zone and above the signal line which gives a weak signal to sell EUR/USD.
The Stochastic Oscillator is in the neutral zone, the %K line is above the %D line which points to the bullish mood.
Trading recommendations
Support levels: 1.12500, 1.12000
Resistance levels: 1.12800, 1.13000, 1.13250
If the price fixes below 1.12500, expect the quotes to fall toward 1.12000.
Alternatively, the quotes can recover toward 1.13200-1.13400.
The GBP/USD currency pair
Technical indicators of the currency pair:
Prev Open: 1.31946
Open: 1.32053
% chg. over the last day: +0.05
Day’s range: 1.31661 – 1.32150
52 wk range: 1.2438 – 1.4378
GBP/USD is in a long flat. The key support and resistance levels are 1.31600 and 1.32250. The Brexit remains in the spotlight. As a reminder, last week the British parliamentaries voted to handle the Brexit situation themselves, revoking Theresa May’s rights. Today the parliamentaries will vote on different Brexit options. Keep tracking this situations and open positions from the key levels.
The Economic News Feed for 27.03.2019 is calm.
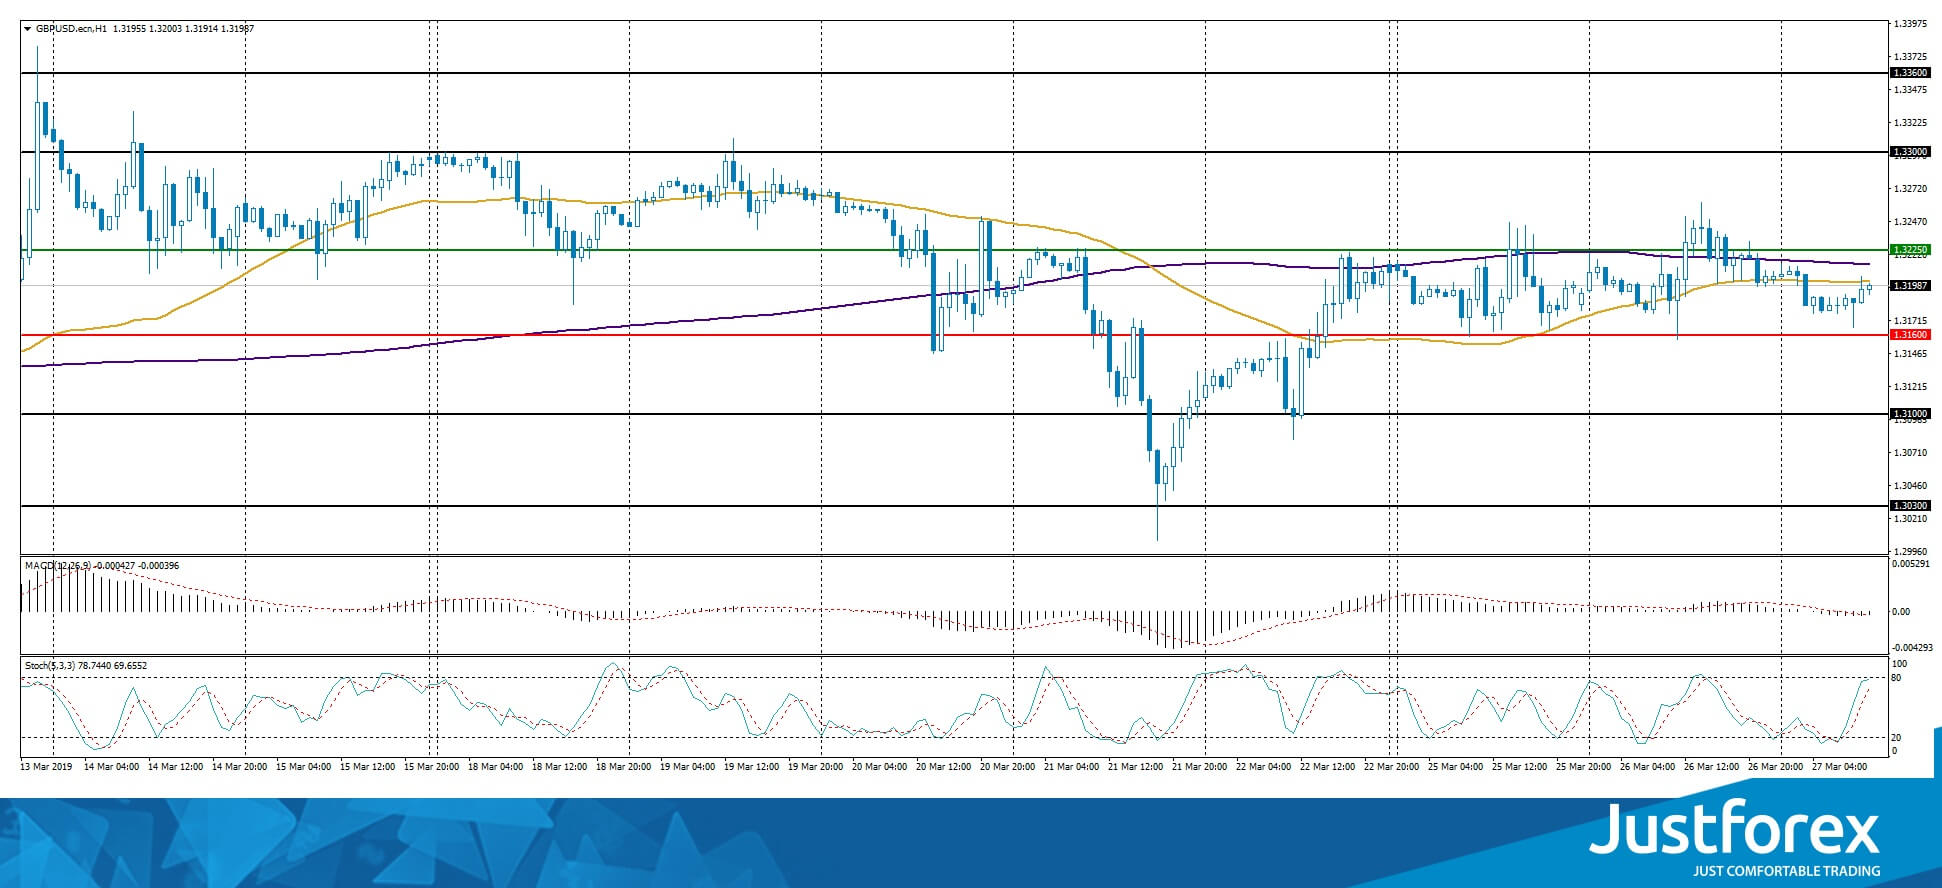
The indicators do not provide precise data, the price has crossed 50 MA and 200 MA.
The MACD histogram is close to 0.
The Stochastic Oscillator is in the neutral zone, the %K line is above the %D line which points to the bullish mood.
Trading recommendations
Support levels: 1.31600, 1.31000, 1.30300
Resistance levels: 1.32250, 1.33000, 1.33600
If the price fixes above 1.32250, expect the quotes to grow toward 1.32750-1.33000.
Alternatively, the quotes can fall toward 1.31000.
This article reflects a personal opinion and should not be interpreted as an investment advice, and/or offer, and/or a persistent request for carrying out financial transactions, and/or a guarantee, and/or a forecast of future events.
The USD/CAD currency pair
Technical indicators of the currency pair:
Prev Open: 1.34064
Open: 1.33843
% chg. over the last day: -0.16
Day’s range: 1.33783 – 1.34052
52 wk range: 1.2248 – 1.3664
USD/CAD shows a variety of trends. The trading instrument is consolidating. The financial market participants are waiting for additional drivers. CAD is testing the local support and resistance levels at 1.33750 and 1.34100. The USD/CAD quotes have a tendency to descend. Keep an eye on the oil quotes dynamics and open positions from the key levels.
The Economic News Feed for 27.03.2019 is calm.
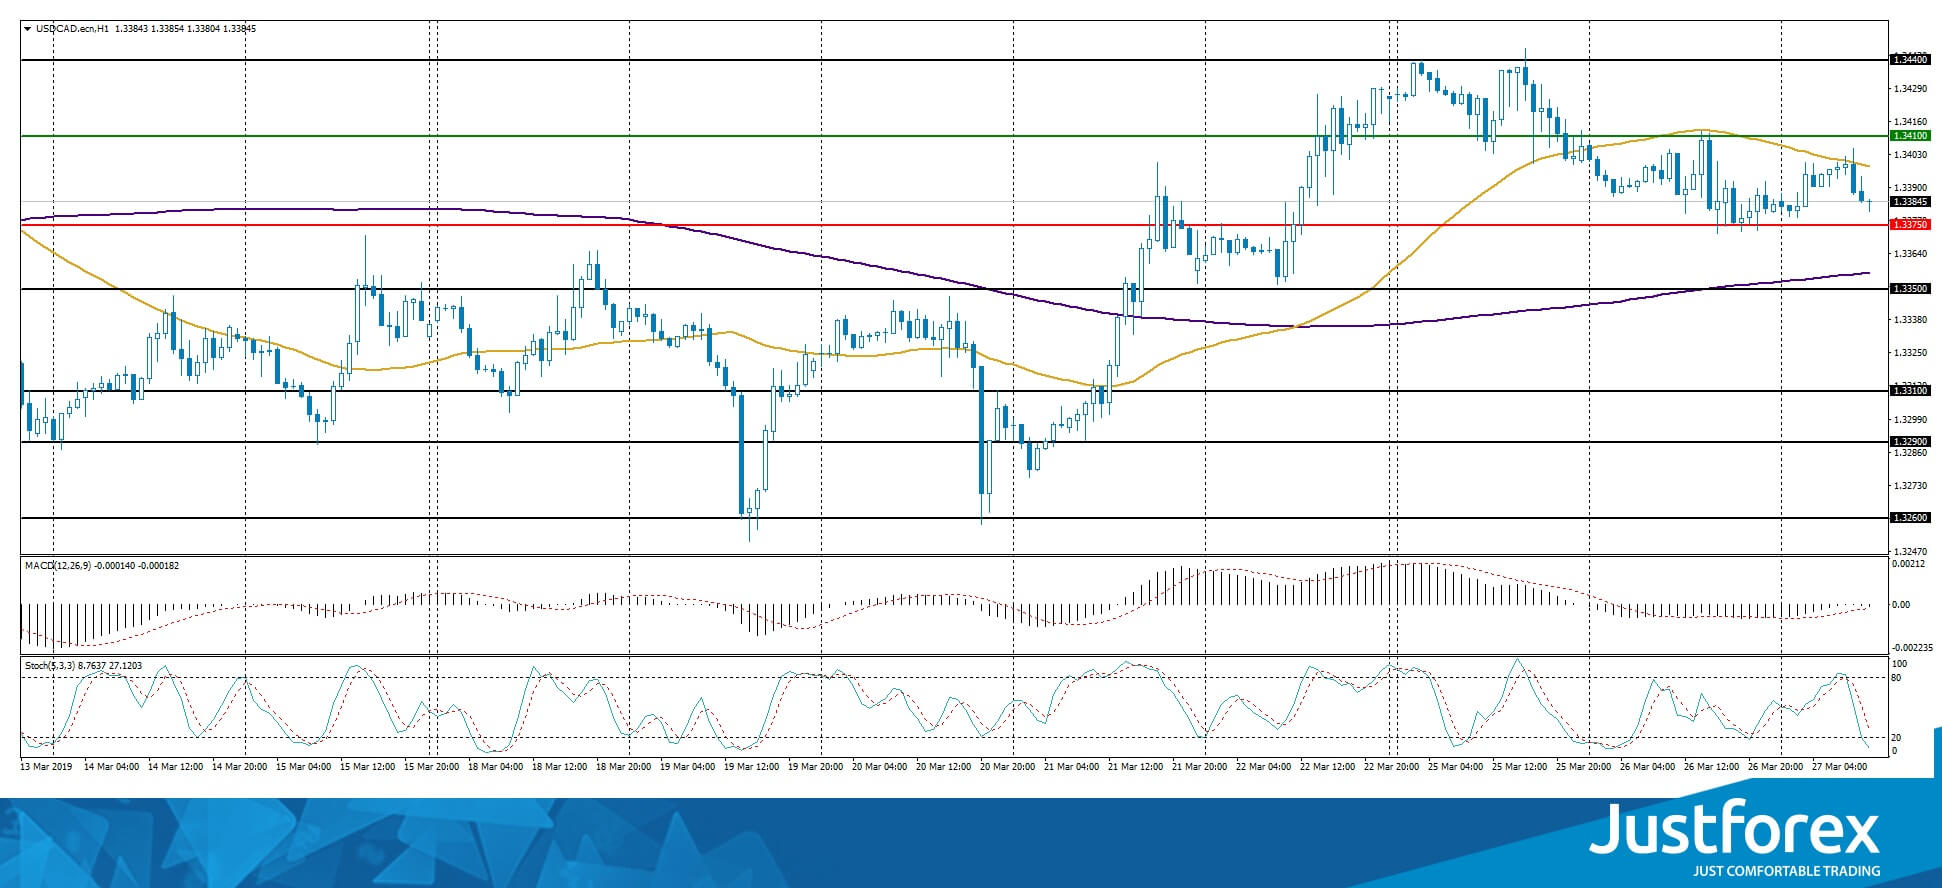
The indicators do not provide precise signals, the price fixed between 50 MA and 200 MA.
The MACD is close to 0.
The Stochastic Oscillator is near the oversold zone, the %K line is below the %D line which points to the bearish mood.
Trading recommendations
Support levels: 1.33750, 1.33500, 1.33100
Resistance levels: 1.34100, 1.34400, 1.35000
If the price fixes below 1.33750, expect the quotes to fall toward 1.33500-1.33200.
Alternatively, the quotes can grow toward 1.34300-1.34600..
The USD/JPY currency pair
Technical indicators of the currency pair:
Prev Open: 109.977
Open: 110.591
% chg. over the last day: -0.55
Day’s range: 110.407 – 110.711
52 wk range: 104.56 – 114.56
USD/JPY retreated from the monthly maximums. Yesterday the quotes grew by 60 points and are currently consolidating around 110.400-110.700. It’s possible that the bearish mood will return soon due to weak economic releases from the US and a fall of the US Treasury bonds’ yield. You should open positions from the key levels.
The Economic News Feed for 27.03.2019 is calm.
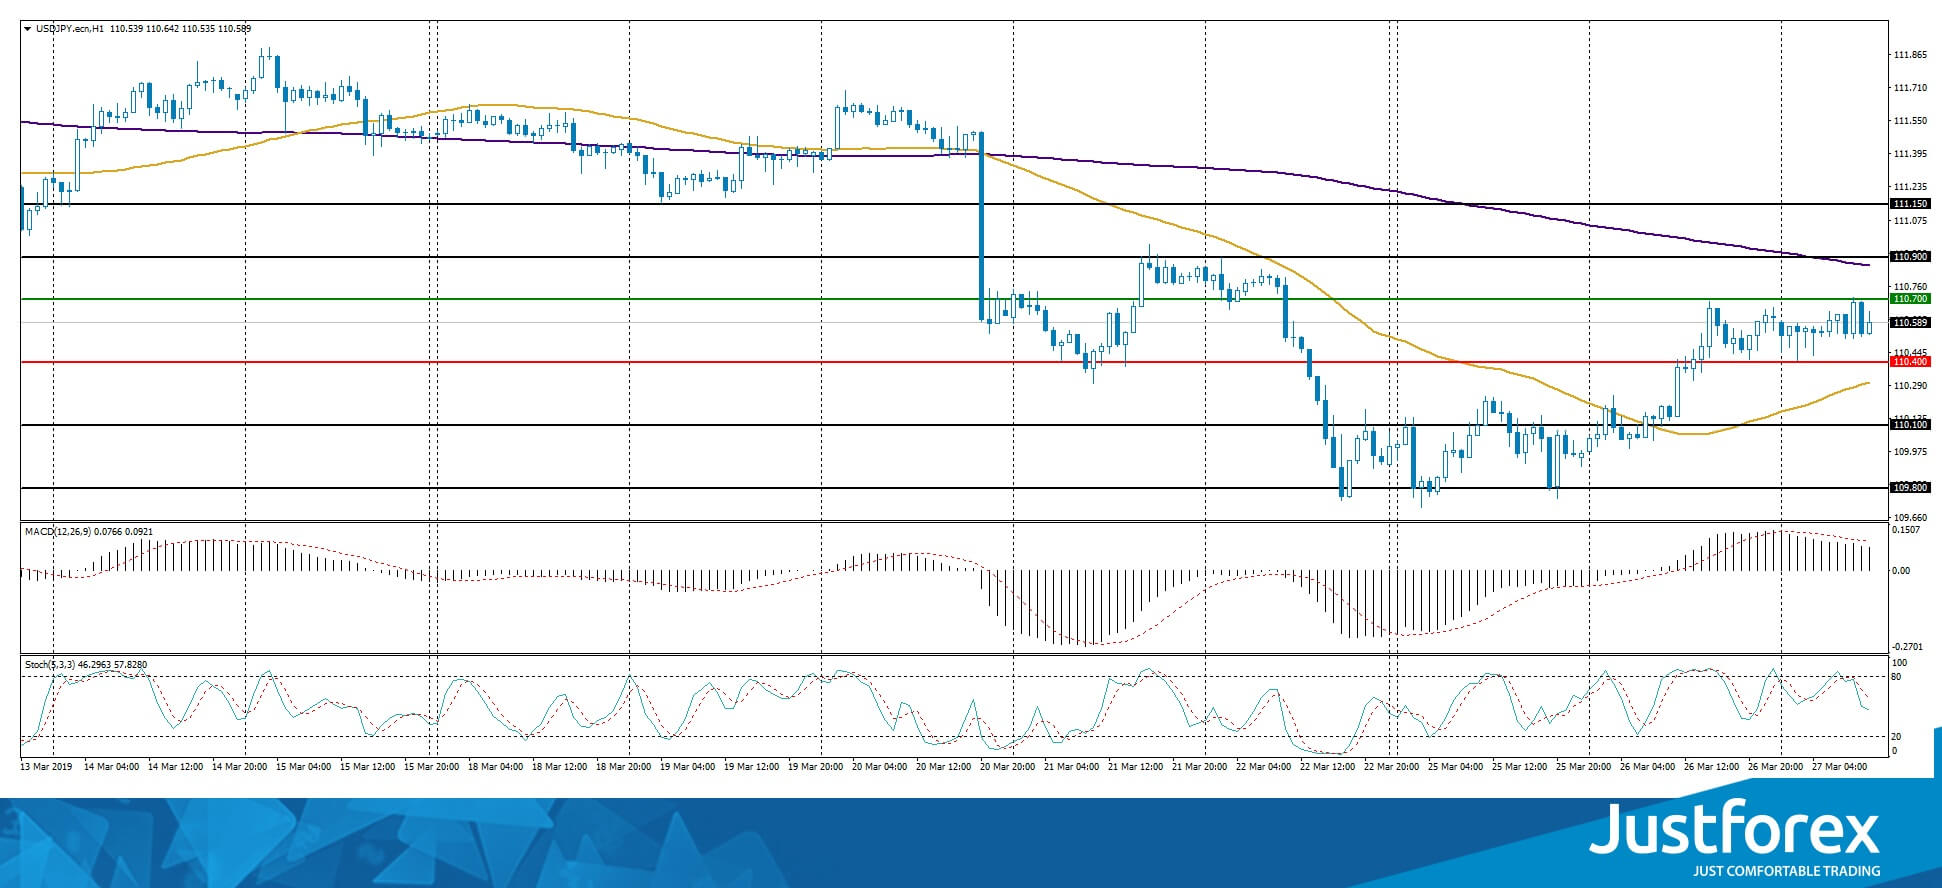
The indicators do not provide precise signals, the price fixed between 50 MA and 200 MA.
The MACD histogram is in the positive zone and below the signal line which gives a weak signal to buy USD/JPY.
The Stochastic Oscillator is in the neutral zone, the %K line is below the %D line which points to the bullish mood.
Trading recommendations
Support levels: 110.400, 110.100, 109.800
Resistance levels: 110.700, 110.900, 111.150
If the price fixes below 110.400, expect the quotes to fall toward 110.000-109.800.
Alternatively, the quotes can recover toward 111.000-111.200.