
The EUR/USD currency pair
Technical indicators of the currency pair:
Prev Open: 1.13623
Open: 1.13731
% chg. over the last day: +0.23
Day’s range: 1.14107 – 1.14342
52 wk range: 1.1214 – 1.2557
The EUR/USD had a variety of trends yesterday, before the Federal Reserve meeting. As expected, the regulator increased the key interest range by 25 basis points up to 2.50%. However, the investors were disappointed to hear the key interest rate will be increased only two times in 2019 instead of three times. You should open positions from the key support and resistance levels of 1.14000 and 1.4400.
The Economic News Feed for 20.12.2018:
PMI index by the Philadelphia Federal Reserve (US) – 15:30 (GMT+2:00).
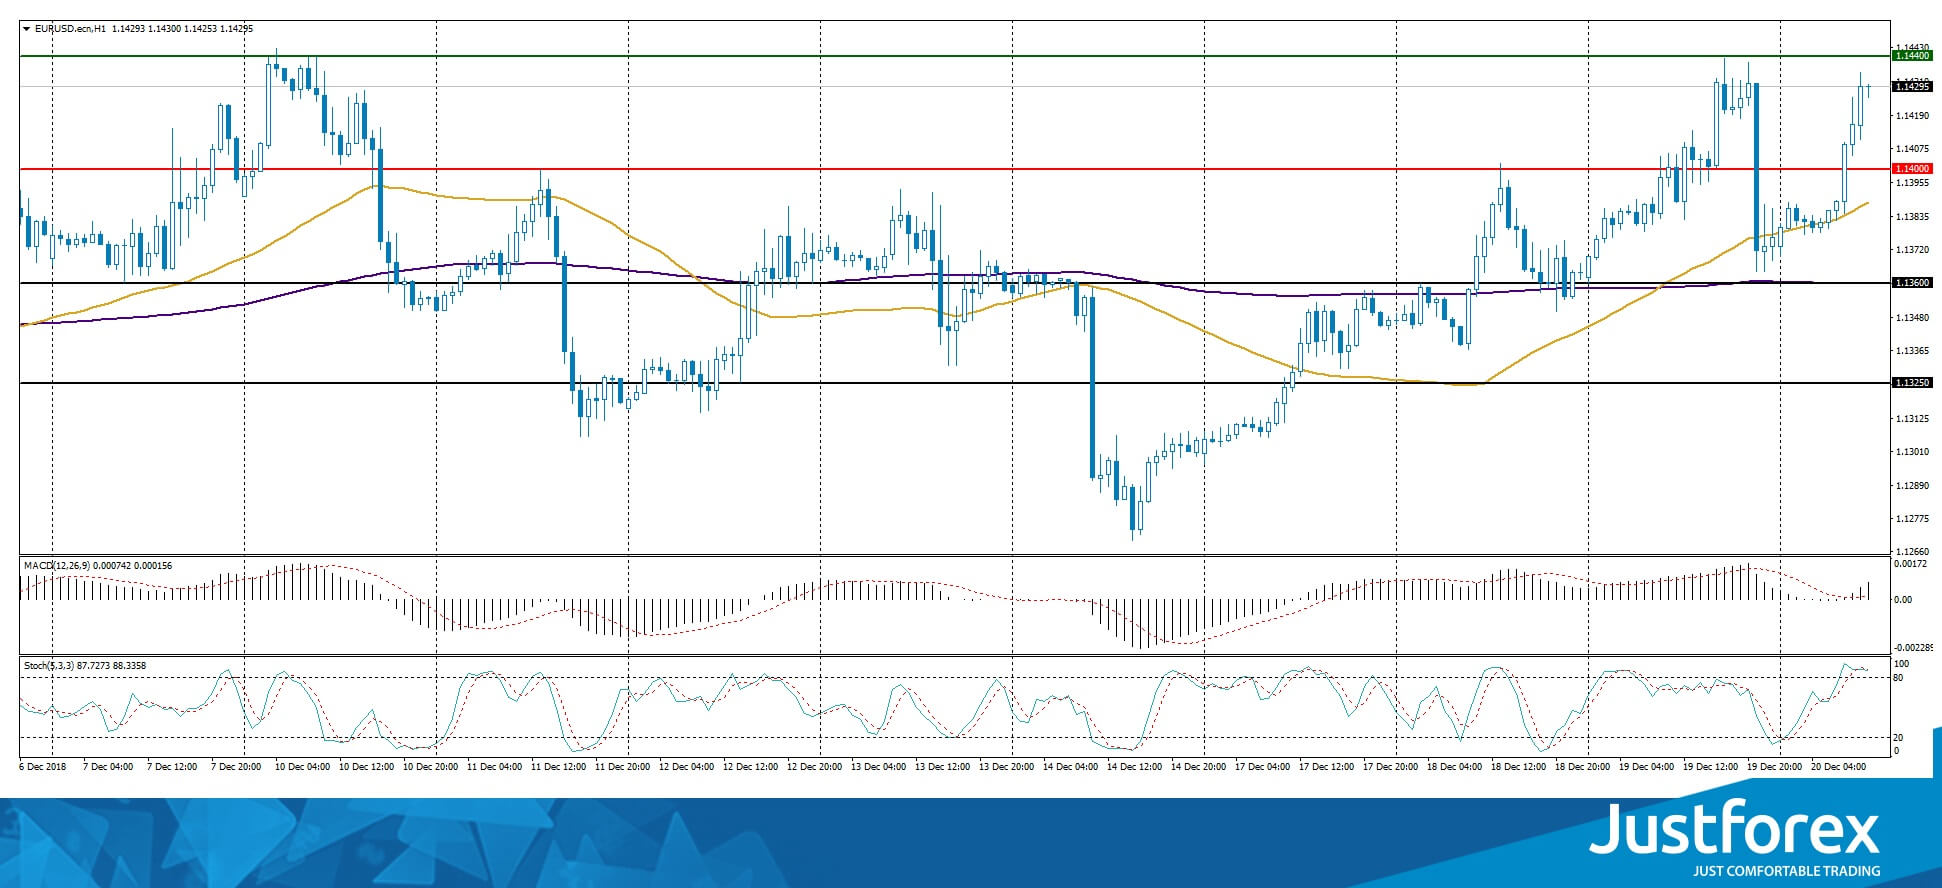
Indicators point toward the power of the buyers: the price fixed above 50 MA and 200 MA.
The MACD histogram is in the positive zone, the price fixed above 50 MA and 200 MA.
The Stochastic Oscillator is in the overbought zone, the %K line crosses the %D line. There are no signals at the moment.
Trading recommendations
Support levels: 1.14000, 1.13600, 1.13250
Resistance levels: 1.14400, 1.14750
If the price fixes above 1.14400, expec the EUR/USD to grow toward 1.14750-1.15000.
Alternatively the quotes can descend toward 1.13600-1.13250.
The GBP/USD currency pair
Technical indicators of the currency pair:
Prev Open: 1.26300
Open: 1.26079
% chg. over the last day: -0.17
Day’s range: 1.26585 – 1.26657
52 wk range: 1.2477 – 1.4378
GBP/USD is showing a variety of trends. The investors are waiting for the Bank of England meeting, where the regulator is expected to keep the current interest rate at 0.75%. You should open positions from the key levels of 1.26300 and 1.26800.
The Economic News Feed for 20.12.2018:
Retail Sales Volume Report (UK) – 11:30 (GMT+2:00);
Bank of England Meeting on Key Interest Rate (UK) – 14:00 (GMT+2:00);
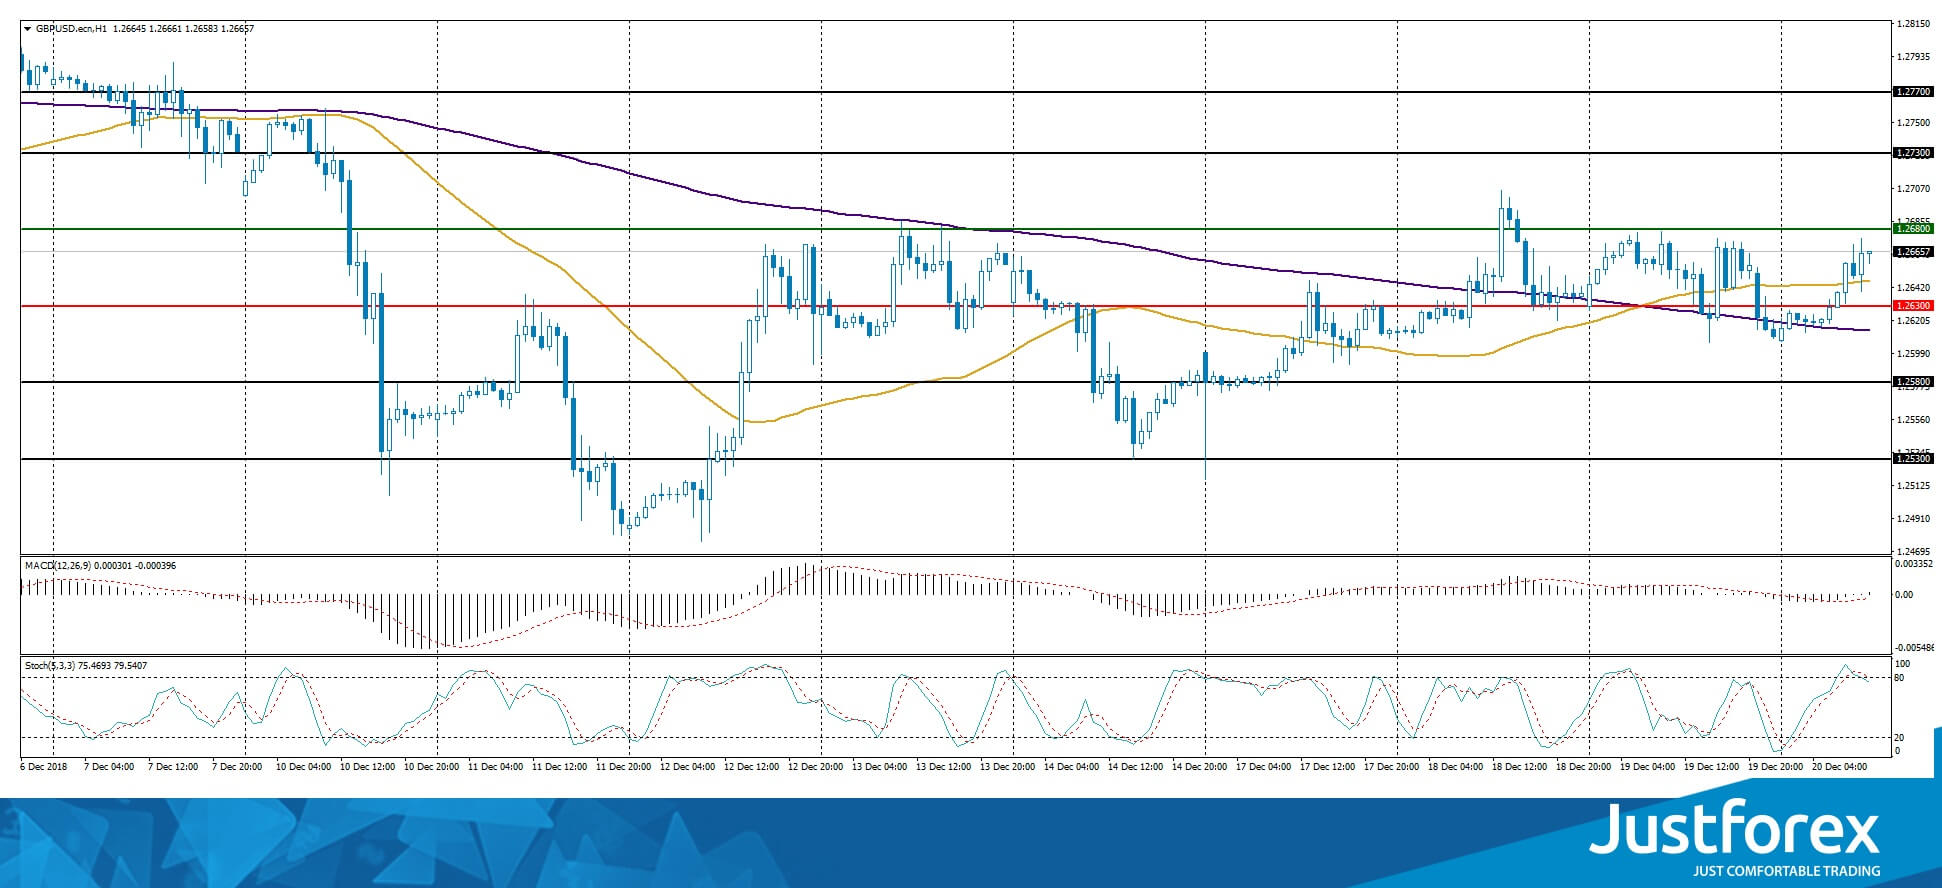
The indicators do not provide precise signals, the price is testing 50 MA.
The MACD histogram is close to 0, there are no signals at the moment.
The Stochastic Oscillator is in the overbought zone, the %K line crosses the %D line. There are no signals at the moment.
Trading recommendations
Support levels: 1.26300, 1.25800, 1.25300
Resistance levels: 1.26800, 1.27300, 1.27700
If the price fixes below 1.26800, consider buying GBP/USD. The movement will tend toward 1.27300-1.27700.
Alternatively the quotes can descend toward the round 1.26000.
The USD/CAD currency pair
Technical indicators of the currency pair:
Prev Open: 1.34624
Open: 1.34842
% chg. over the last day: +0.08
Day’s range: 1.34662 – 1.35043
52 wk range: 1.2248 – 1.3506
The USD/CAD currency pair has a variety of trends. The trading instrument is testing the annual maximums. The financial market participants are waiting for the Federal Reserve meeting. You should open positions from the key support and resistance levels of 1.34600 and 1.35000. A technical correction after a long rally is highly possible.
You should keep an eye on the US economic reports.
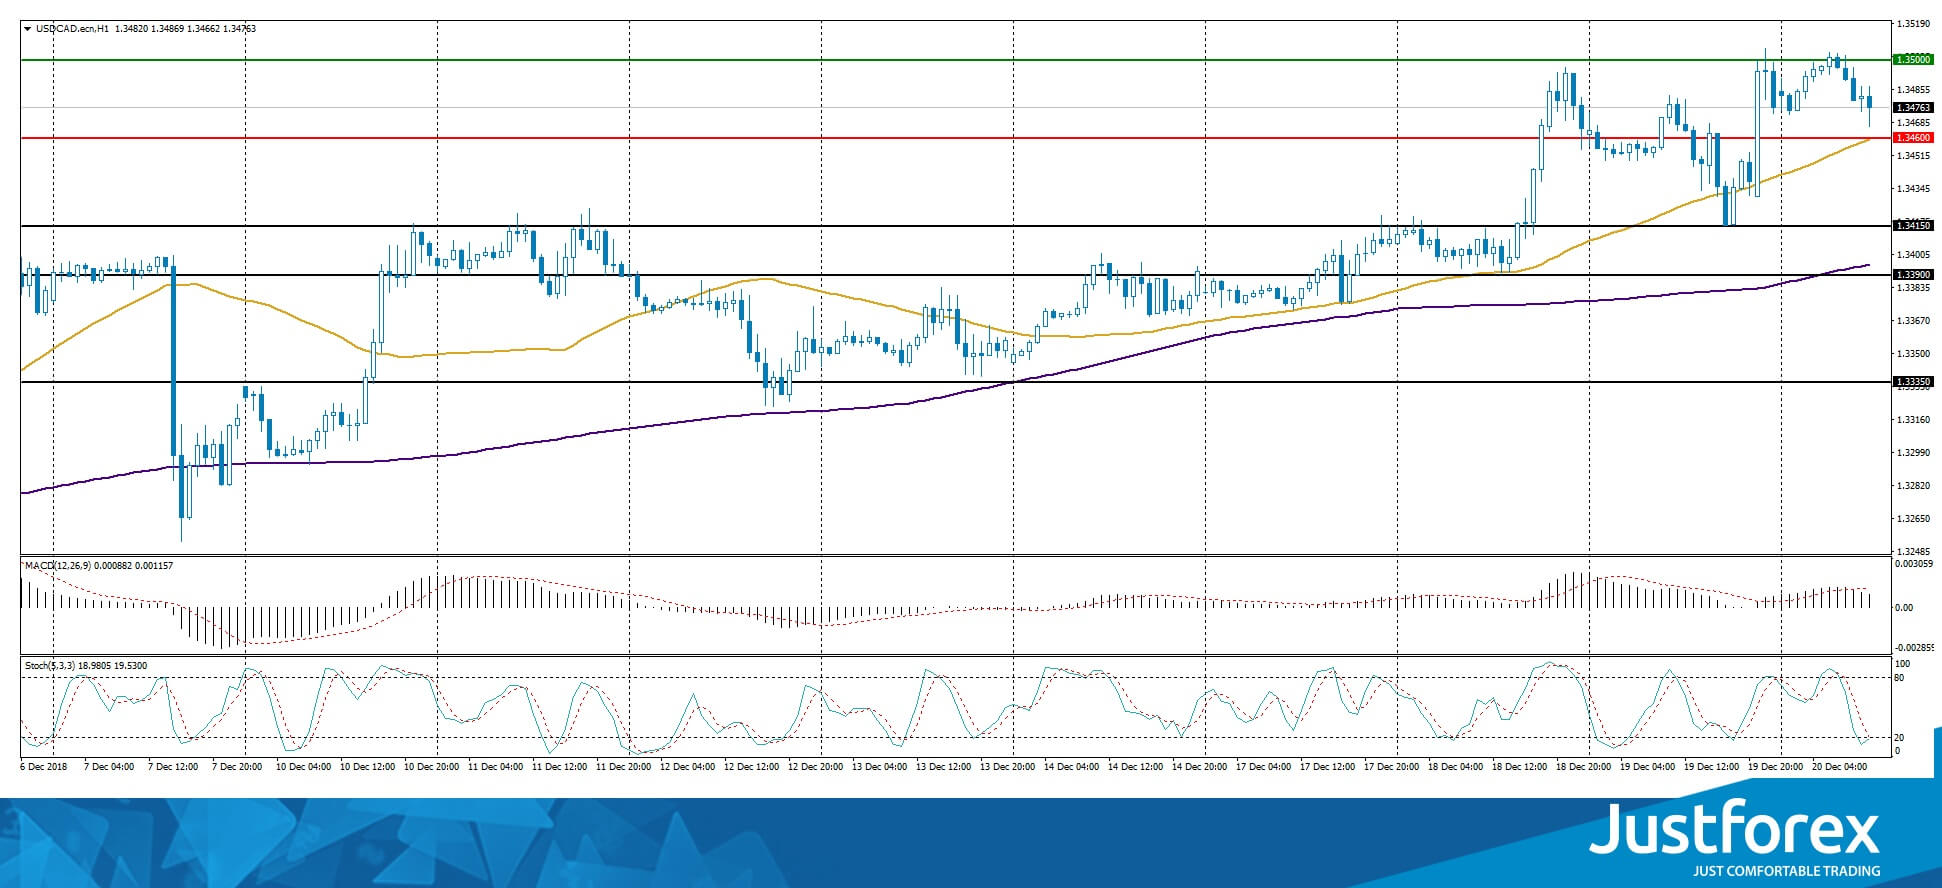
The price fixed above 50 MA and 200 MA which points toward the power of the buyers.
The MACD histogram is in the positive zone but below the signal line which gives a weak signal toward purchasing USD/CAD.
The Stochastic Oscillator reached the oversold zone, the %K line has crossed the %D line. There are no signals at the moment.
Trading recommendations
Support levels: 1.34600, 1.34150, 1.33900
Resistance levels: 1.35000, 1.35500
If the price fixes above the round 1.35000 expect further growth of the USD/CAD quotes. The movement will tend toward 1.35400-1.35600.
Alternatively the price can fix below 1.34600 and you should look for market entry points to open short positions. The movement will tend toward 1.34200-1.34000.
The USD/JPY currency pair
Technical indicators of the currency pair:
Prev Open: 112.497
Open: 112.406
% chg. over the last day: -0.11
Day’s range: 111.742 – 112.604
52 wk range: 104.56 – 114.56
The USD/JPY currency pair keeps showing a negative trend. The JPY strengthened against the USD by more than 150 points. The USD/JPY quotes are testing the local support at 111.750 with 112.250 being a mirror support. The trading instrument can descend further.
The Bank of Japan, as was expected, kept the fundamental parameters of the monetary policy. The Central Bank also informs that the country`s economy is showing a stable growth.
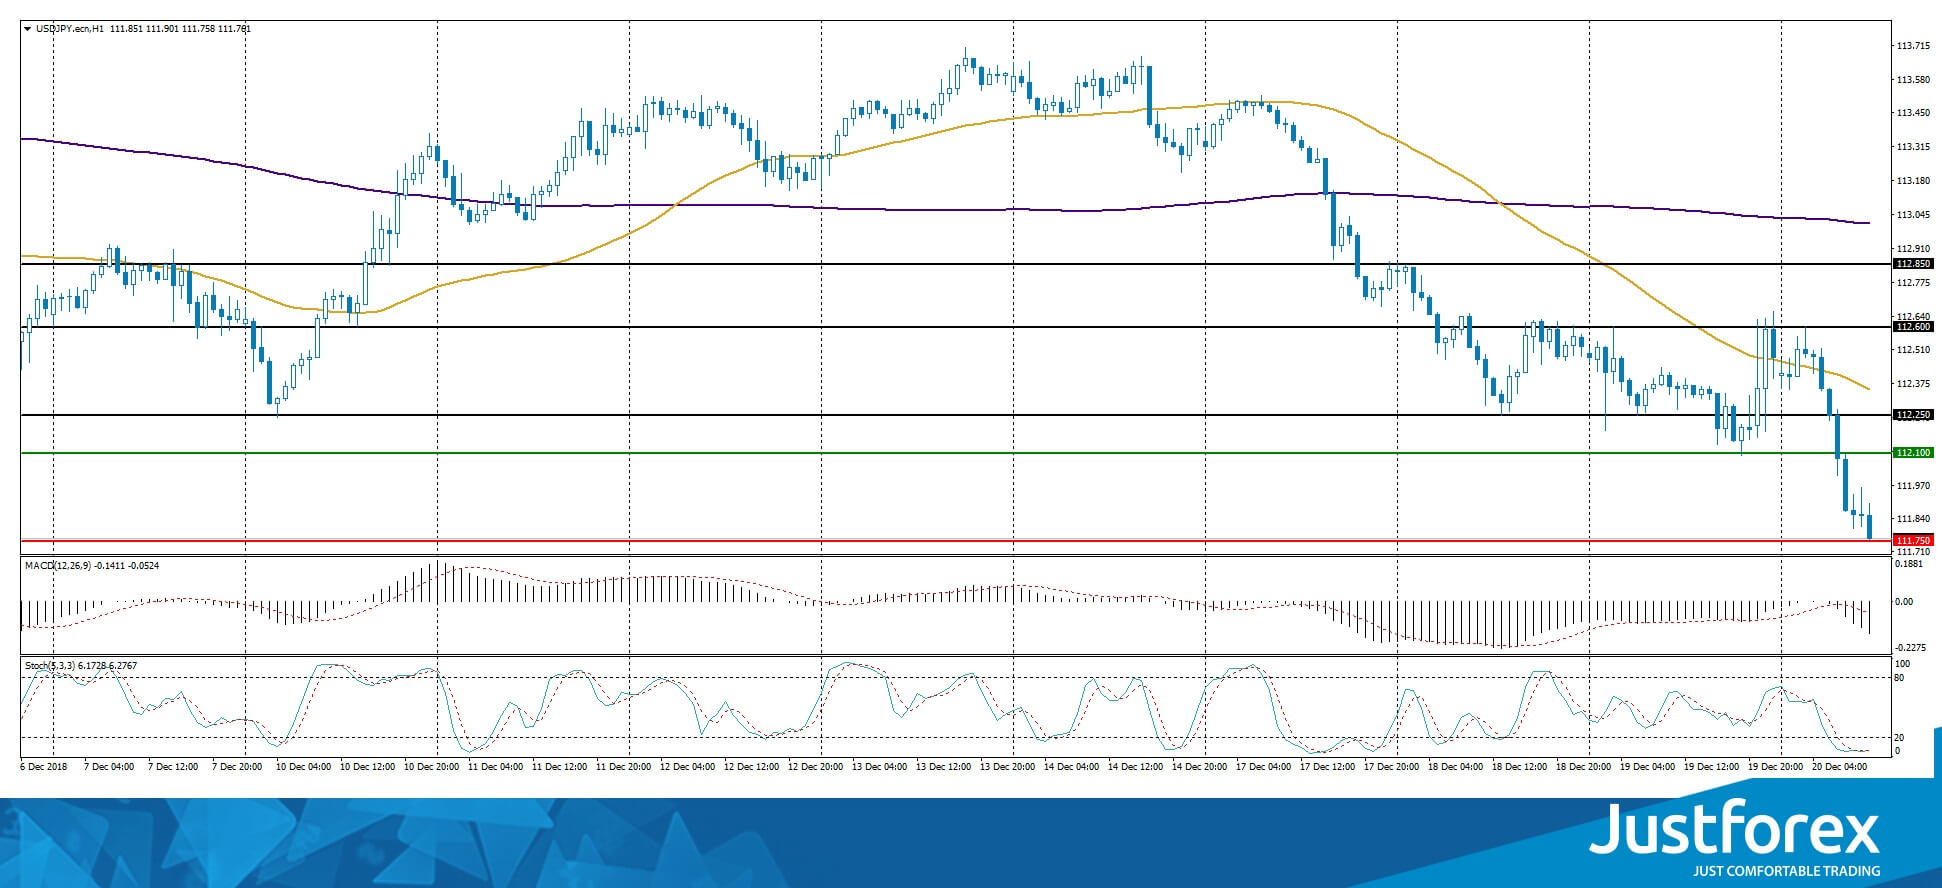
The indicators point toward the power of the sellers, the price fixed below 50 MA and 200 MA.
The MACD histogram is in the negative zone and below the signal line, which gives a strong signal toward selling USD/JPY.
The Stochastic Oscillator is in the oversold zone, the %K line crosses the %D line. There are no signals at the moment.
Trading recommendations
Support levels: 111.750, 111.400
Resistance levels: 112.100, 112.250, 112.600
If the price fixes below the 111.750 support level, expect further descend of the USD/JPY quotes. The movement will tend toward 111.400-11.200.
Alternatively the quotes can recover 112.250-112.400.