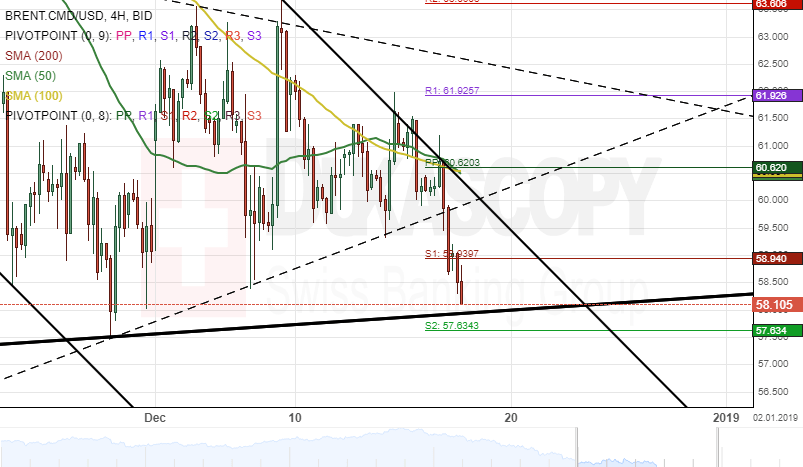
The BRENT.CMD/USD pair has been trading in a symmetric triangle pattern since the end of November. The commodity tested the upper boundary of the triangle pattern on December 7.
As shown on the chart, a breakout occurred through the bottom border of the pattern during the Asian trading session on Tuesday.
Given that a breakout had occurred, it is likely that the UK’s crude oil price will continue to edge lower within this session.
The potential downside target for the commodity price will be near the weekly S3 at 56.03.