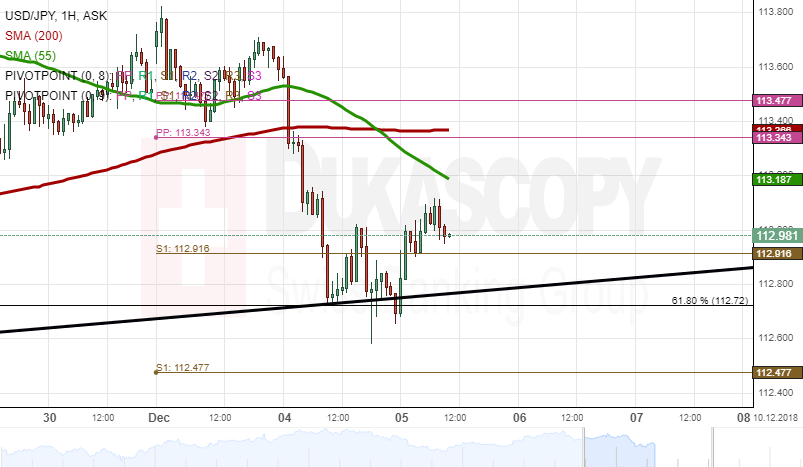
During Tuesday ‘s trading session, the large pattern line at 112.72 and the 61.80% Fibo stopped the rate from the depreciation to end the trading session at the 112.67 mark. During Wednesday’s morning hours, the US Dollar was trading between the monthly pivot point and the weekly S1 at the 112.99 mark.
In regards to the near-term future, most likely, the US Dollar will trade downside to pass through the most of the technical indicator support levels to stay near the 50.00% Fibonacci retracement level at the 112.16 mark.
However, the support levels of the technical indicators could push the rate to break the resistances of the 55-hour and the 200-hour SMA to trade near the 113.60.