Sat, Feb 07, 2026 08:48 GMT
More
    HomeContributorsTechnical AnalysisGBP/USD Bearish Wave C Tests Triangle Chart Pattern

    GBP/USD Bearish Wave C Tests Triangle Chart Pattern

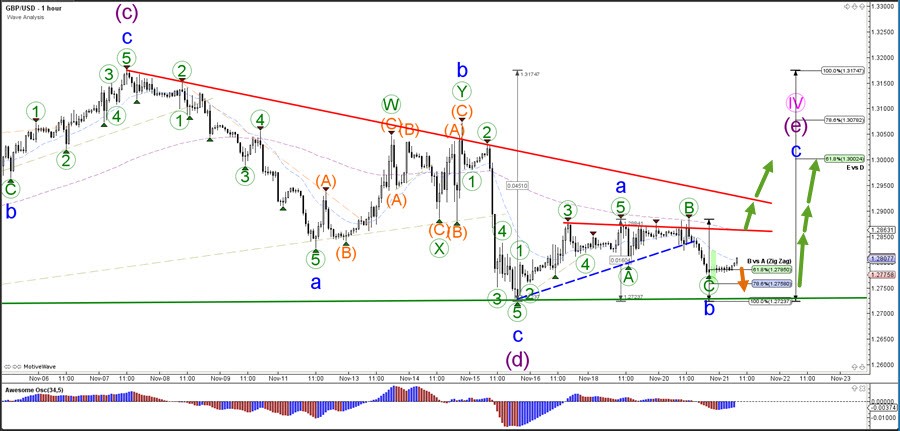
    The GBP/USD is expected to make a bullish bounce back towards the top of the triangle pattern unless price breaks below the support line (green). The Fibonacci levels of wave E vs D could act as potential resistance levels.

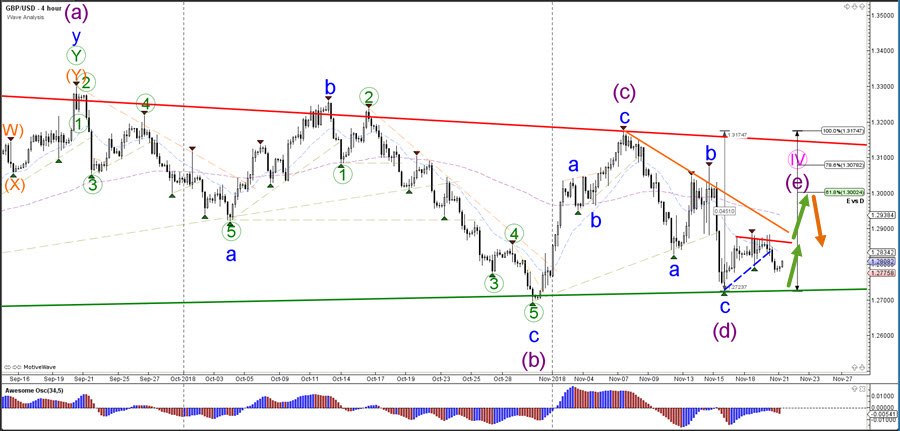
    The GBP/USD has completed or is close to completing a wave C (green) within waveB (blue). A bullish bounce is expected if price indeed completes the bullish ABC (blue) zigzag correction.

    admiral
    admiralhttps://www.elitecurrensea.com/
    Elite CurrenSea Accessible Forex Trading Systems & Education With over 30 years of combined trading experience, we design, test, and provide successful Forex, CFDs & Crypto trading systems and solutions for retail and institutional traders alike.

    Latest Analysis

    Learn Forex Trading