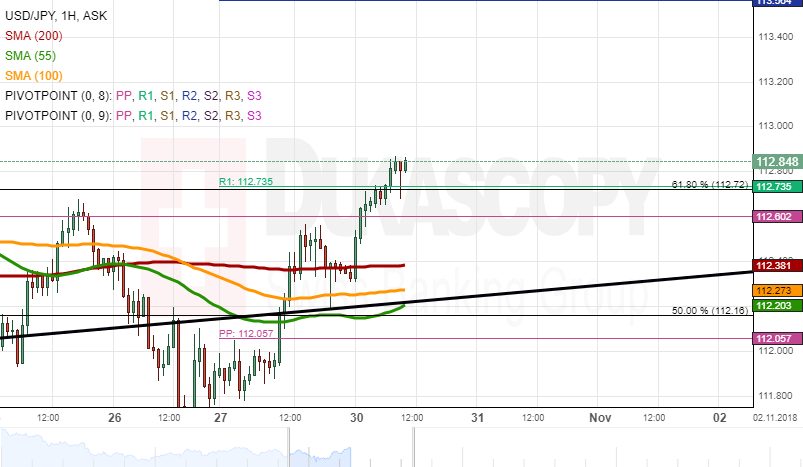
During Monday’s trading session, the rate broke the resistances of the simple moving averages to end the trading day at the 112.30 mark. On Tuesday morning, the US Dollar broke the resistances of the three technical indicators to trade above the weekly R1 at the 112.83 mark.
In regards to the near-term future, most likely, the US Dollar will move upside towards the weekly R2 at 113.56 due to the support of the weekly R2 at 112.73 and the support of the 61.80% Fibo at 112.72.
Besides, none of the technical indicators and official fundamentals could prevent the currency exchange pair from the surge on Tuesday.