A note on lower timeframe confirming price action…
Waiting for lower timeframe confirmation is our main tool to confirm strength within higher timeframe zones, and has really been the key to our trading success. It takes a little time to understand the subtle nuances, however, as each trade is never the same, but once you master the rhythm so to speak, you will be saved from countless unnecessary losing trades. The following is a list of what we look for:
- A break/retest of supply or demand dependent on which way you’re trading.
- A trendline break/retest.
- Buying/selling tails … essentially we look for a cluster of very obvious spikes off of lower timeframe support and resistance levels within the higher timeframe zone.
- Candlestick patterns. We tend to only stick with pin bars and engulfing bars as these have proven to be the most effective.
EUR/USD
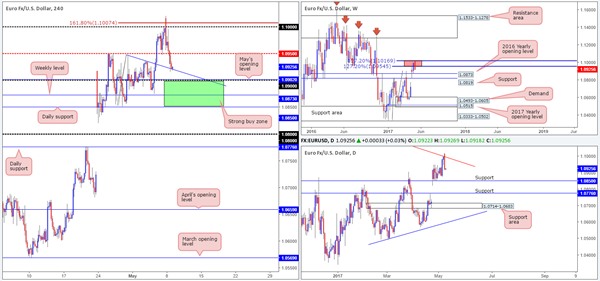
As anticipated, the single currency shook hands with the large psychological number 1.10/ H4 161.8% Fib ext. at 1.1007 drawn from the low 1.0851 and sold off. Bolstering this area was not only two weekly 127.2% Fib extensions at 1.1016/1.0954 (red zone) taken from the lows 1.0340/1.0493, but also a daily trendline resistance extended from the high 1.1616. Well done to any of our readers who managed to jump aboard here!
With the H4 mid-level support at 1.0950 now out of the picture, price is currently seen teasing a H4 trendline support etched from the high 1.0947. Also of note is May’s opening level pegged just below at 1.0902/psychological handle 1.09.
Our suggestions: Attempting to join the bearish momentum seen from the above said higher-timeframe structures is chancy given we have the following supports (green area) in view:
- May’s opening level pegged just below at 1.0902/psychological handle 1.09.
- 2016 yearly opening level at 1.0873 (see weekly chart).
- Daily support at 1.0850.
On account of this, we now favor longs. However, we will not become buyers in this market UNTIL we witness a reasonably sized bullish rotation candle form within the noted green zone (preferably a full-bodied candle).
Data points to consider: FOMC member Kaplan speaks at 9.15pm GMT+1.
Levels to watch/live orders:
- Buys: 1.0850/1.09 ([waiting for a reasonably sized H4 bull candle [preferably a full-bodied candle] to form before pulling the trigger is advised] stop loss: ideally beyond the candle’s tail).
- Sells: Flat (stop loss: N/A).
GBP/USD
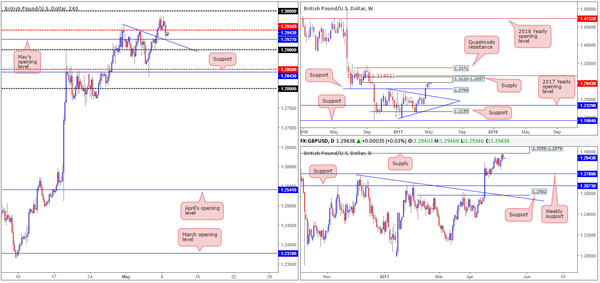
As can be seen from the H4 chart, price was unable to sustain gains beyond the mid-level resistance 1.2950 during yesterday’s segment. This move was likely influenced by the fact that both weekly and daily action are currently seen trading at the underside of supplies at the moment (1.3120-1.2957/1.3058-1.2979).
Despite this, the downside to this market looks incredibly limited. There’s a H4 trendline support extended from the high 1.2965, May’s opening level at 1.2927 and the nearby round number at 1.29 to contend with!
Our suggestions: In the absence of clearer price action, opting to stand on the sidelines may very well be the better path to take today.
Data points to consider: FOMC member Kaplan speaks at 9.15pm GMT+1.
Levels to watch/live orders:
- Buys: Flat (stop loss: N/A).
- Sells: Flat (stop loss: N/A).
AUD/USD
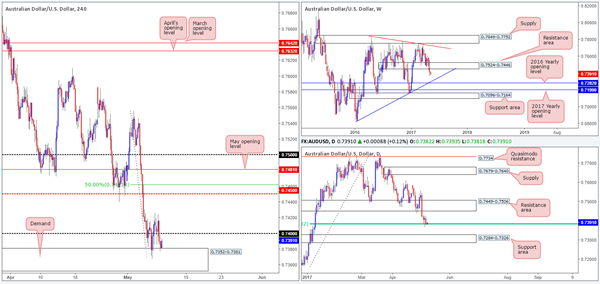
Coming in from the top this morning, we can see that weekly bears continue to push this market lower after breaking through the support zone at 0.7524-0.7446. Should this momentum continue, it’s likely that the trendline support extended from the low 0.6827 and 2016 yearly opening level at 0.7282 will be brought into the picture.
Down on the daily candles, the long-term 61.8% Fib’ support at 0.7832 (drawn from the low 0.7159) appears to be on the verge of giving way. A violation of this hurdle will bring the support area at 0.7284-0.7326 into view, which intersects beautifully with the above noted weekly trendline support and sits just above the 2016 yearly opening level.
Jumping across to the H4 chart, the buyers and sellers have been seen battling for position around the 0.74 handle since Thursday last week. Also noteworthy here is the demand coming in at 0.7352-0.7381.
Our suggestions: Despite the H4 chart showing demand in play, the higher-timeframe structures suggest that this market may be headed lower. With that said, this places traders in a rather precarious position: sell into H4 demand or buy into potential higher-timeframe flow?
As far as we can see, technical elements are mixed at the moment leaving us with little choice but to remain flat for now.
Data points to consider: Aussie retail sales figures at 2.30am, Aussie Annual budget release at 10.30am. FOMC member Kaplan speaks at 9.15pm GMT+1.
Levels to watch/live orders:
- Buys: Flat (stop loss: N/A).
- Sells: Flat (stop loss: N/A).
USD/JPY
USD/JPY bulls went on the offensive yesterday and pulled the H4 candles above the 113 handle. Consequent to this, the H4 mid-level resistance at 113.50 is now in sight, which happens to intersect nicely with a H4 trendline resistance pegged from the low 111.68 (green circle).
Although 113.50 is a possible sell zone, traders might want to take into consideration that the weekly candles show room to advance up to the supply area at 115.50-113.85. This – coupled with daily action also showing room to stretch up to a resistance area coming in at 115.62-114.60, signals potential weakness around 113.50!
Our suggestions: Instead of looking to short from 113.50, our team’s focus is on buying any retest seen off the 113 handle. Be that as it may, before our desk commits here, we’d need to see a reasonably sized H4 bull candle form following the retest – ideally a full-bodied candle. Frist take-profit target would, of course, be 113.50, followed by the underside of weekly supply at 113.85.
Data points to consider: FOMC member Kaplan speaks at 9.15pm GMT+1.

Levels to watch/live orders:
- Buys: 113 region ([waiting for a reasonably sized H4 bull candle [preferably a full-bodied candle] to form before pulling the trigger is advised] stop loss: ideally beyond the candle’s tail).
- Sells: Flat (stop loss: N/A).
USD/CAD
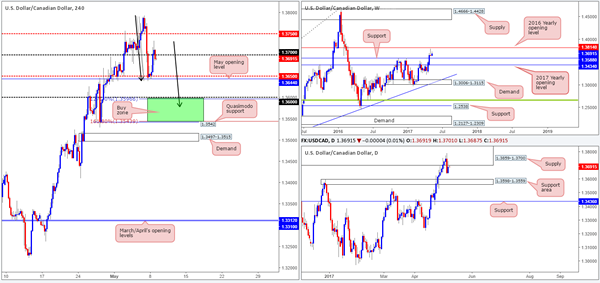
In recent trading, the pair managed to recover well from May’s opening level at 1.3644/H4 mid-level support at 1.3650. However, the 1.37 handle has so far proven to be a bit of a challenge to overcome. What’s also notable from a technical perspective, however, is the possible H4 AB=CD structure taken from the high 1.3793 (black arrows). Although the 1:1 pattern terminates just below the 1.36 handle, a bullish rotation from here is still highly likely. Note the daily support area coming in at 1.3598-1.3559 and the weekly support level drawn from 1.3588!
Our suggestions: Quite simply, our team is looking for long opportunities between the 127.2/161.8% AB=CD Fib’ extensions at 1.3542/1.36 today. In an ideal world, we’d want to see a reasonably sized H4 full-bodied bull candle form within this green zone. The reason we require additional confirmation here is to avoid the possibility of getting stopped out on any fakeout seen to the H4 demand planted below at 1.3497-1.3515.
Data points to consider: FOMC member Kaplan speaks at 9.15pm GMT+1.
Levels to watch/live orders:
- Buys: 113 region ([waiting for a reasonably sized H4 bull candle [preferably a full-bodied candle] to form before pulling the trigger is advised] stop loss: ideally beyond the candle’s tail).
- Sells: Flat (stop loss: N/A).
USD/CAD
In recent trading, the pair managed to recover well from May’s opening level at 1.3644/H4 mid-level support at 1.3650. However, the 1.37 handle has so far proven to be a bit of a challenge to overcome. What’s also notable from a technical perspective, however, is the possible H4 AB=CD structure taken from the high 1.3793 (black arrows). Although the 1:1 pattern terminates just below the 1.36 handle, a bullish rotation from here is still highly likely. Note the daily support area coming in at 1.3598-1.3559 and the weekly support level drawn from 1.3588!
Our suggestions: Quite simply, our team is looking for long opportunities between the 127.2/161.8% AB=CD Fib’ extensions at 1.3542/1.36 today. In an ideal world, we’d want to see a reasonably sized H4 full-bodied bull candle form within this green zone. The reason we require additional confirmation here is to avoid the possibility of getting stopped out on any fakeout seen to the H4 demand planted below at 1.3497-1.3515.
Data points to consider: FOMC member Kaplan speaks at 9.15pm GMT+1.

Levels to watch/live orders:
- Buys: Flat (stop loss: N/A).
- Sells: 1.0016/1.0000 ([waiting for a reasonably sized H4 bear candle [preferably a full-bodied candle] to form before pulling the trigger is advised] stop loss: ideally beyond the candle’s wick).
DOW 30
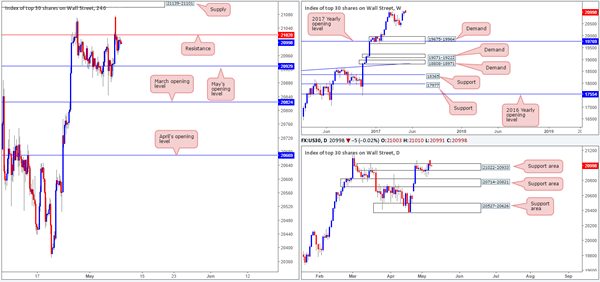
According to daily structure, the resistance area at 21022-20933 could very soon become a zone of support. In the event that this does come to fruition, we’re confident that the index will look to punch to fresh record highs. However, the H4 candles remain capped beneath the resistance level pegged at 21020 for now. This line and the nearby supply zone seen above it at 21139-21101 are, in our opinion, the only barriers now stopping the DOW from popping higher.
Our suggestions: Given where price is positioned on the weekly and daily charts, we do eventually expect the unit to punch higher and continue trending northbound. Nevertheless, we will not become buyers in this market until we witness a decisive H4 close beyond the current H4 supply zone.
Data points to consider: FOMC member Kaplan speaks at 9.15pm GMT+1.
Levels to watch/live orders:
- Buys: Once the H4 supply at 21139-21101 is taken out, longs will be permitted.
- Sells: Flat (stop loss: N/A).
GOLD
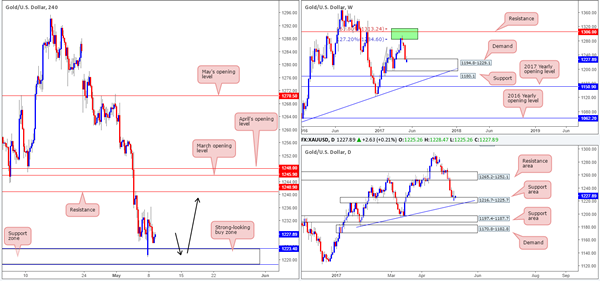
Kicking this morning’s report off with a look-see at the weekly timeframe, we can see that the bulls are beginning to make an appearance from within the walls of demand coming in at 1194.8-1229.1. Along the same lines, daily action remains trading around a support zone coming in at 1216.7-1225.7. Therefore, higher-timeframe structure favors the bulls at this point.
Over on the H4 chart, the H4 support zone at 1218.5-1223.4 (seen lodged within the limits of the said weekly and daily structures) remains intact after being tested during yesterday’s segment.
Our suggestions: In view of the bigger picture (see above), our desk remains biased to the upside. The H4 support area mentioned above is still on our radar for potential longs today. Ideally though, we’d want to see a reasonably sized H4 bull candle present itself here – a full-bodied candle would be perfect – before we commit. As for take-profit targets, the H4 resistance at 1240.9 still looks reasonable for partial profits.
Levels to watch/live orders:
- Buys: 1218.5/1223.4 ([waiting for a reasonably sized H4 bull candle to form before pulling the trigger is advised] stop loss: ideally beyond the candle’s tail).
- Sells: Flat (stop loss: N/A).
