The single European currency has declined massively against the Canadian Dollar since the pair reversed from the upper boundary of a dominant descending channel at 1.60 in mid-March.
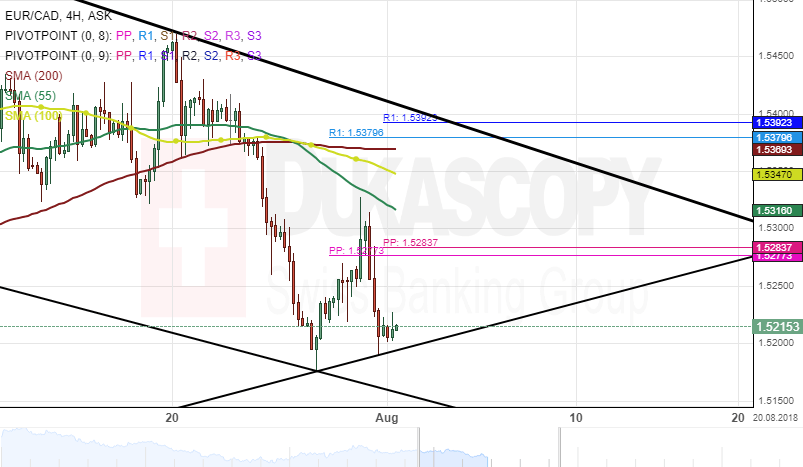
The currency pair has re-tested the bottom border of an uptrend channel on July 29 and made a U-turn to the upside. However, these gains were limited by the moving average and the weekly pivot points.
Technical indicators demonstrate bearish signals. Namely, the 55-, 100-, and 200-hour SMAs crossover above the price. This could suggest that bears are likely to grow stronger during the coming days.