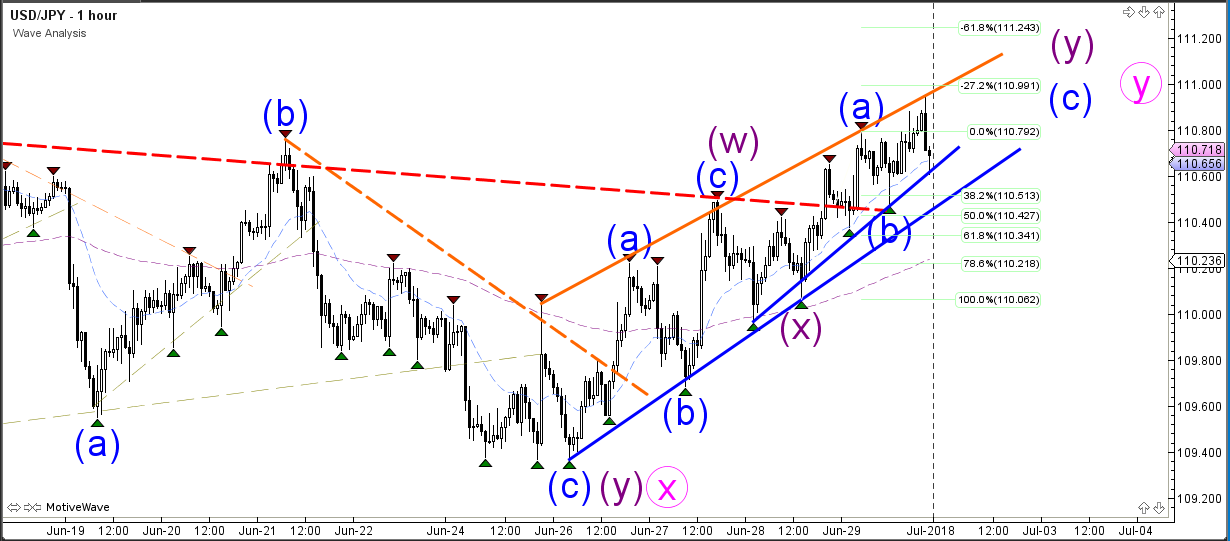
The USD/JPY bullish channel is breaking above a key resistance trend line (dotted red) of a triangle chart pattern, which could indicate a larger bullish continuation within wave Y (pink). A break above the previous top at 111.40 could confirm the wave Y of a larger wave D of the daily chart, which is building a triangle pattern.
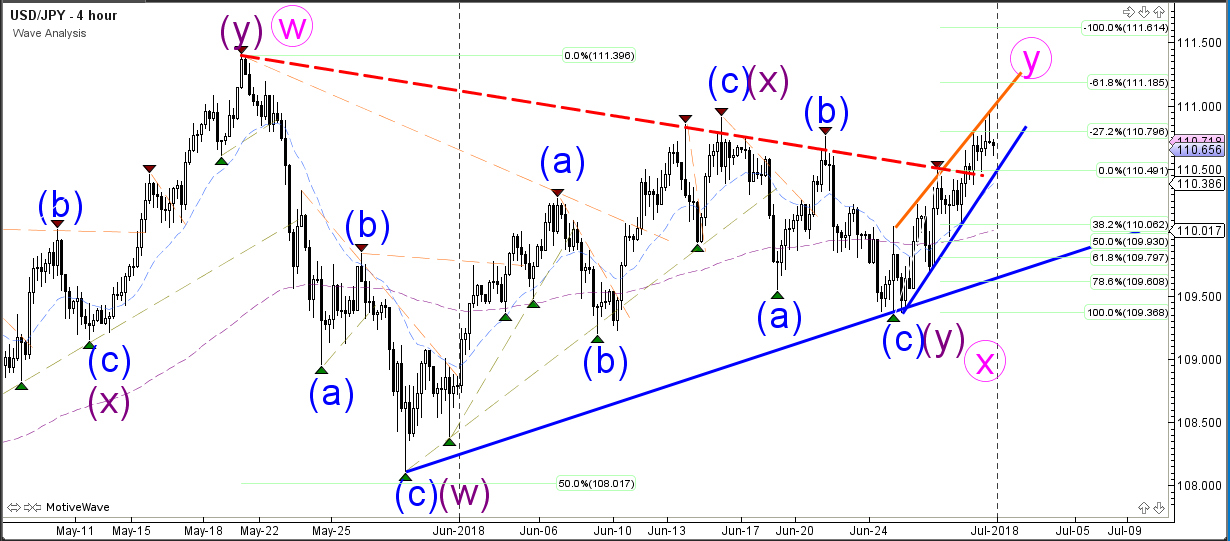
The USD/JPY could find support at the bottom of the channel and move higher towards the Fibonacci targets. A break below the support trend lines indicates a change of perspective, direction, and most likely wave patterns.