EUR/USD
The EUR/USD bounced at the support trend line (blue) which either means that price has completed a truncated wave 5 (pink) within wave A (purple) or that wave 4 (pink) is building an expansion.
Daily chart:
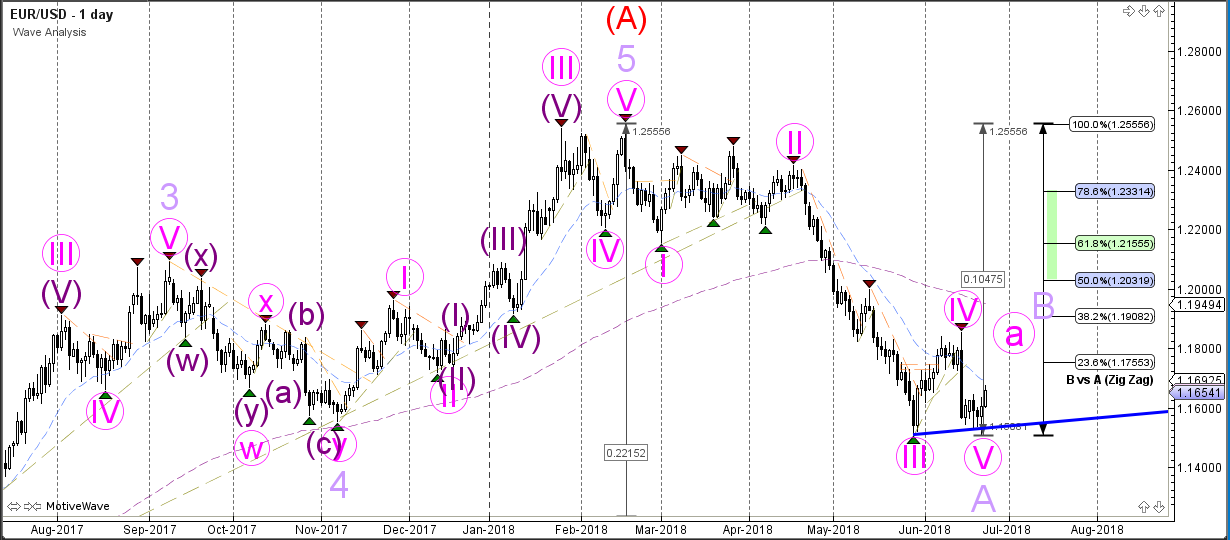
The EUR/USD seems to be building a bearish ABC (purple) correction within wave B (red). The 50% Fibonacci level could be a key support zone.
Weekly chart:
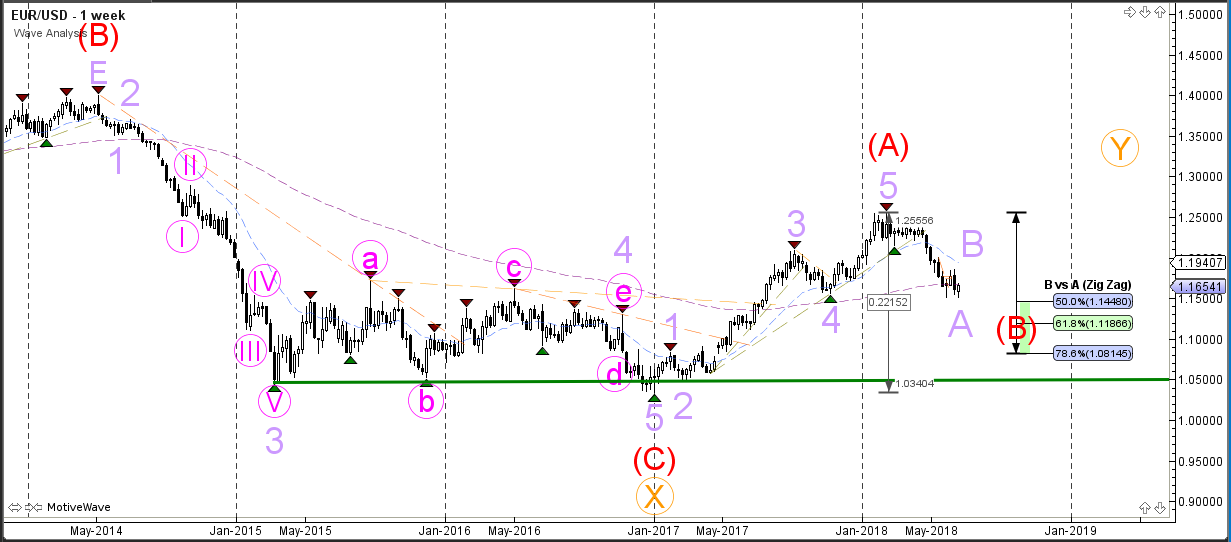
The EUR/USD has probably completed wave A (red) and price is now most likely retracing to the Fibonacci levels of wave B (red).
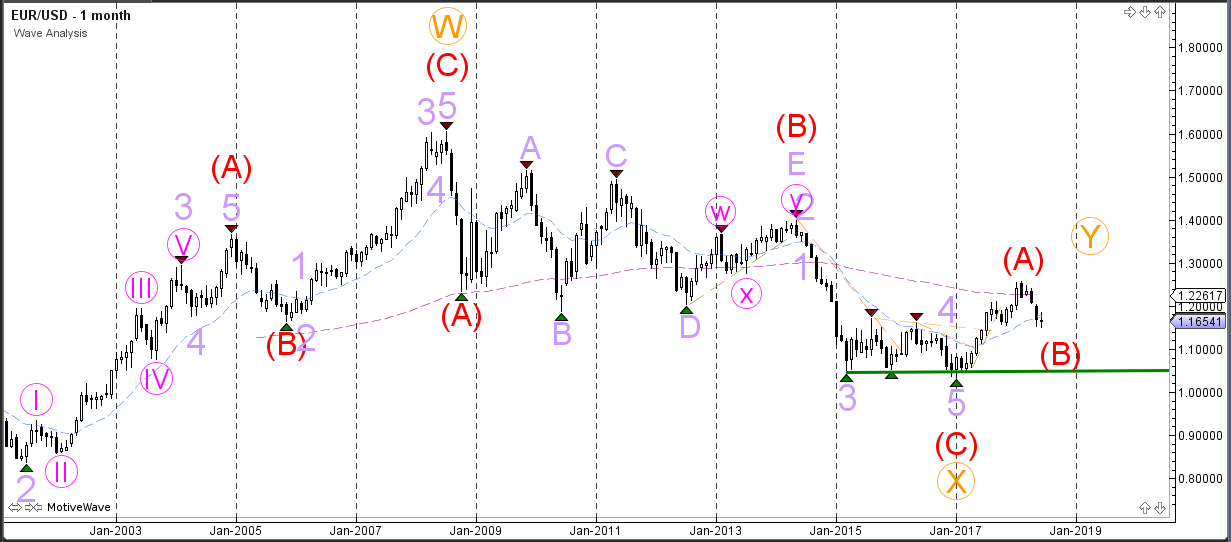
Monthly chart:
GBP/USD
The GBP/USD could now have completed a wave 5 (purple) of a potential wave 1 (pink).
Daily chart:
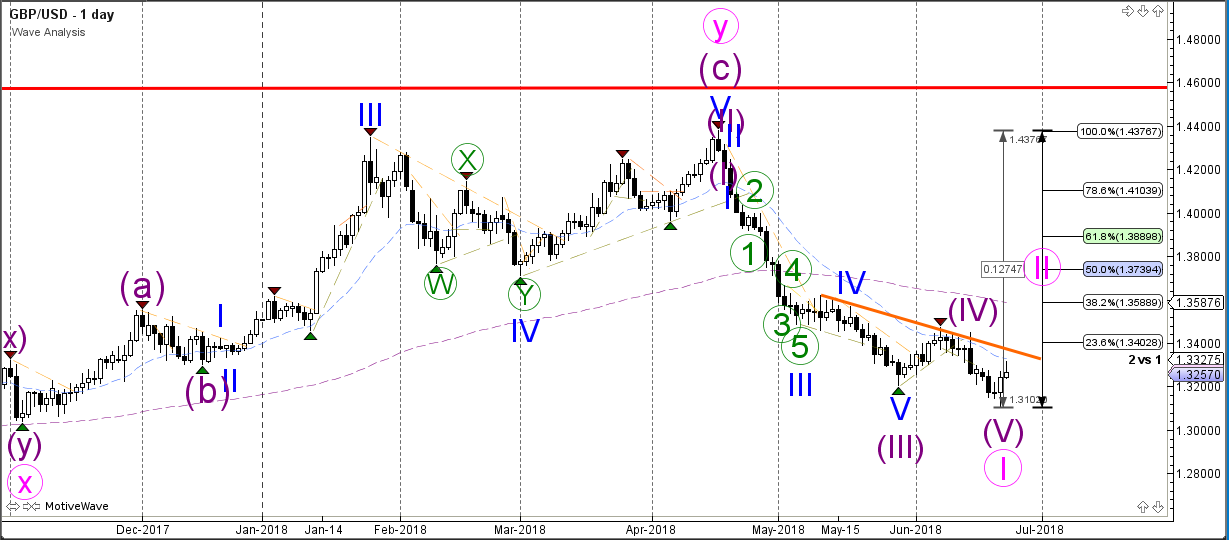
The GBP/USD has probably started the bearish wave 5 after price has completed a wave 4 (light purple) correction.
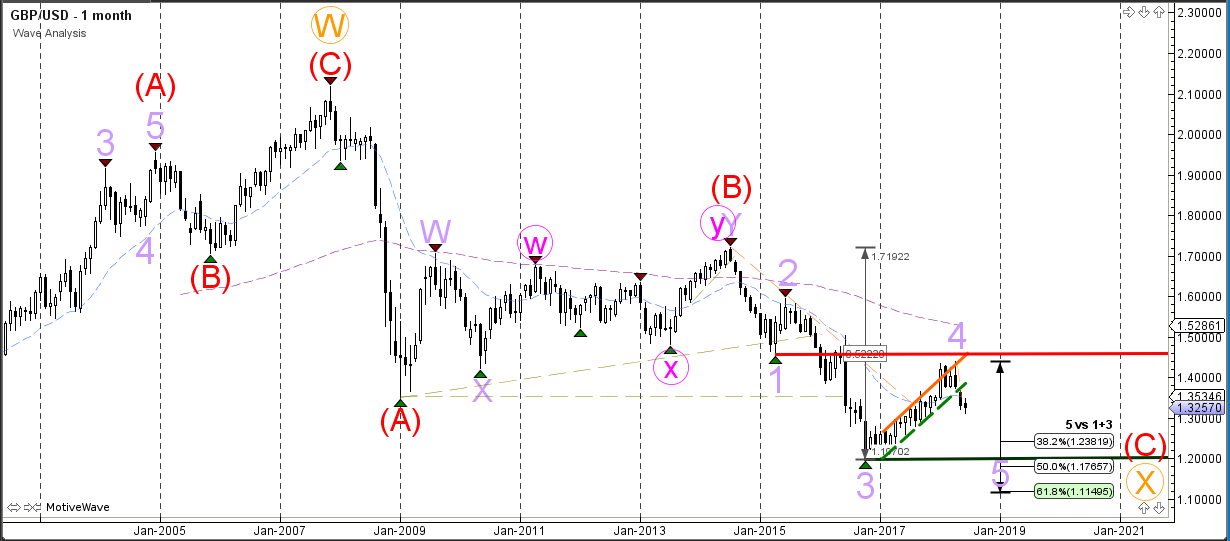
Weekly chart:

The GBP/USD bearish breakout could see the continuation of the wave 5 (purple) whereas a bullish break above resistance (red) could indicate that the wave C has been completed at the bottom.
Monthly chart:
USD/JPY
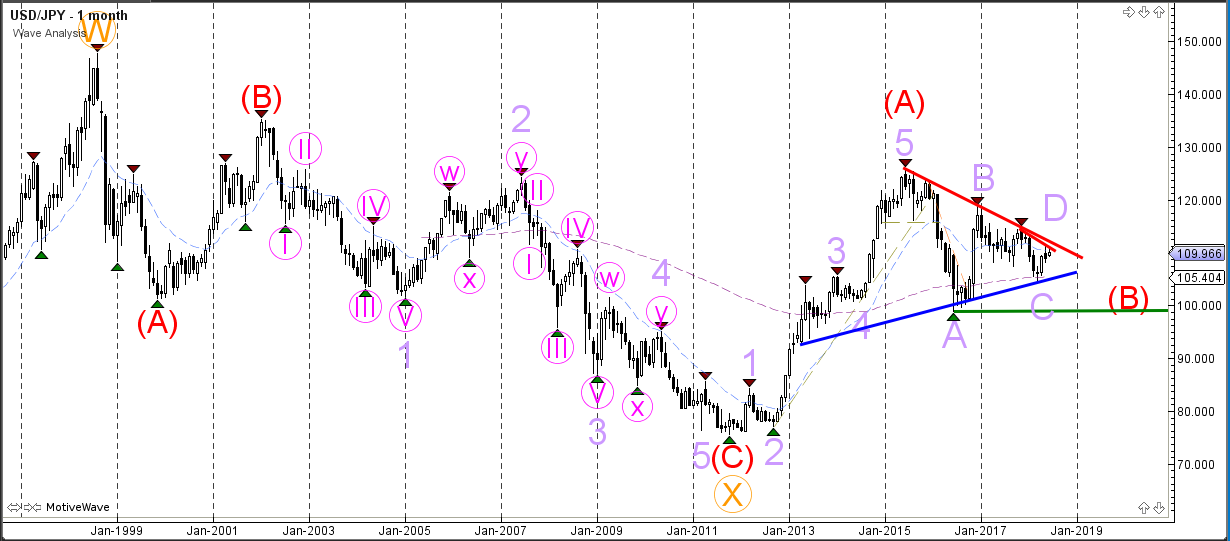
The USD/JPY is testing the support trend lines (blue) and a bearish breakout could see price fall towards the next trend line (green) and Fibonacci levels.
Daily chart:
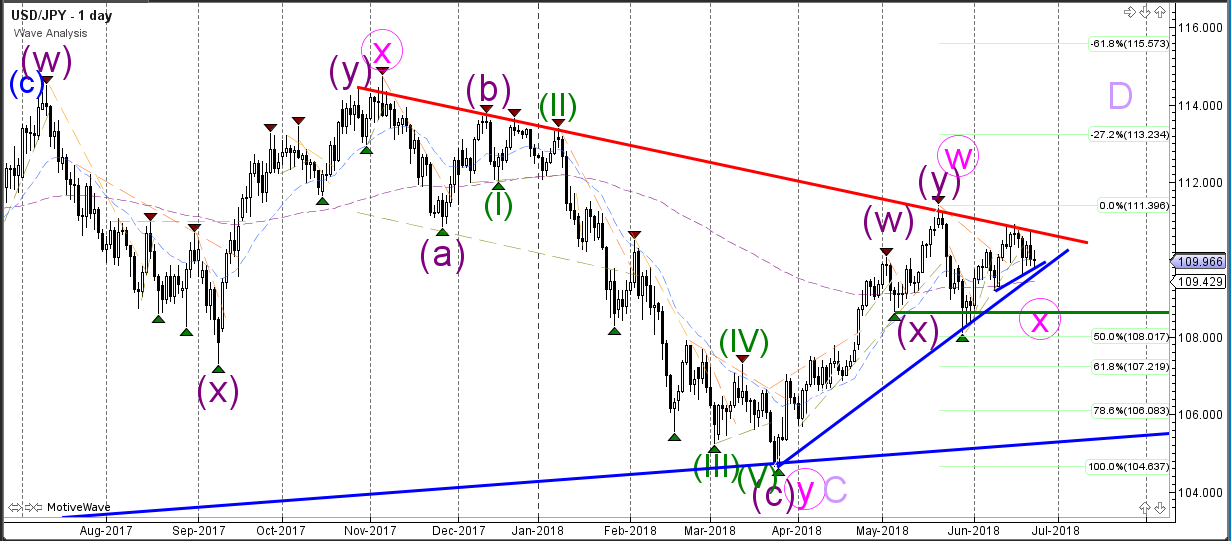
The USD/JPY could be building an ABCDE triangle (light purple) within wave B (red – see monthly chart).
Weekly chart:
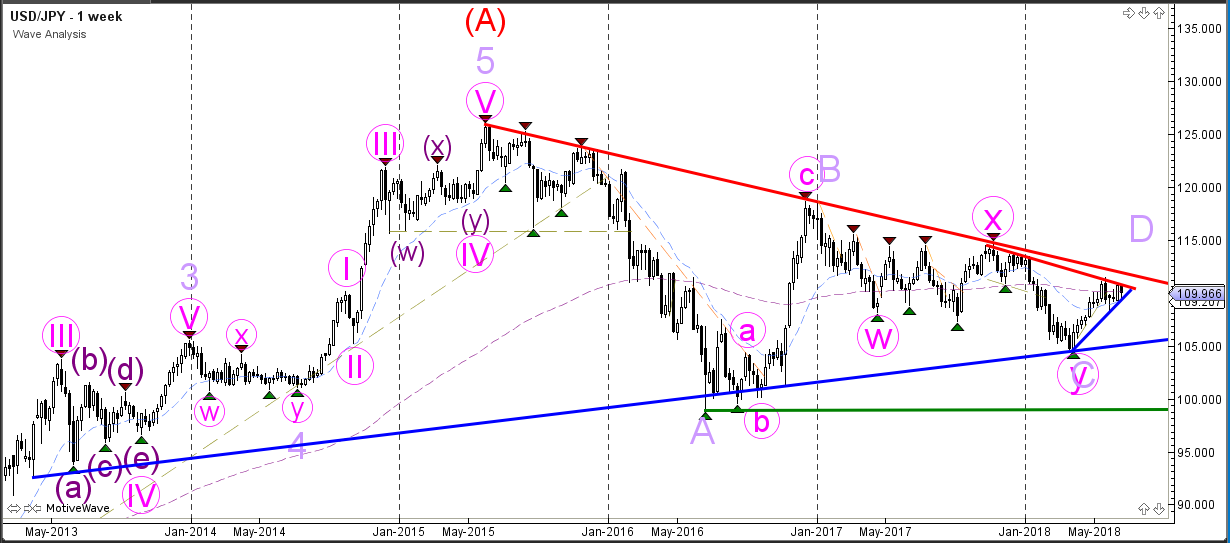
The USD/JPY is in the wave D (light purple) of the triangle pattern.
Monthly chart: