GBP/CHF – 1.2507
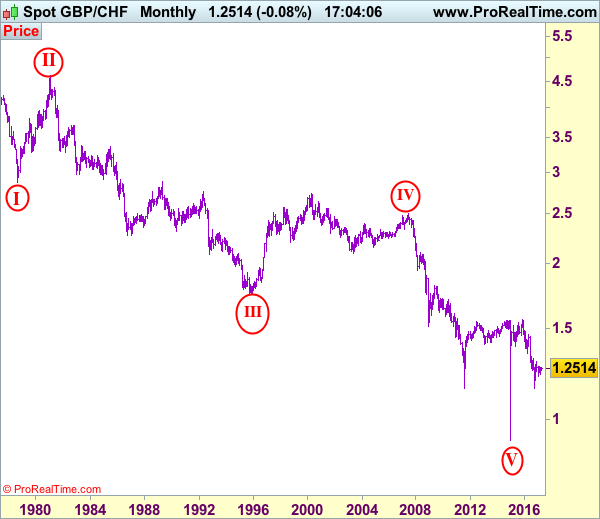
GBP/CHF – Circle wave v ended at 0.9106 and major correction has commenced for subsequent gain to 1.5547.
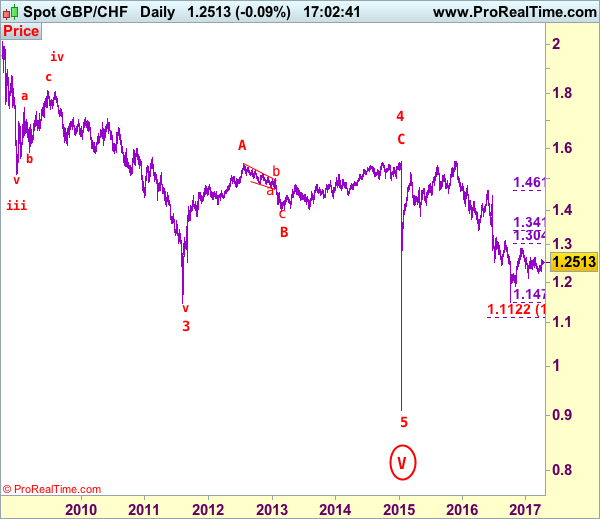
As sterling found decent demand at 1.2285 and has staged a stronger-than-expected rebound, dampening our bearishness and suggesting the fall from 1.2660 has ended at 1.2215 last month, hence upside risk is seen for test of resistance at 1.2596 (last month’s high) but reckon said resistance at 1.2660 would hold from here, bring further choppy trading within early established range. Only a break of 1.2660 would shift risk back to the upside for the rebound from 1.2102 to extend further gain to 1.2745-55, above there would signal the retreat from 1.2915 has ended at 1.2102 and encourage for subsequent rise to 1.2800-10 first.
To recap the larger degree count, the selloff from 2.4965 (July 2007) is the beginning of wave V with circle and is labeled as 1: 2.3760, 2: 2.4425, wave 3 extension ended at 1.1470, followed by wave 4 at 1.5547, the quick rebound from 0.9106 suggests wave 5 as well as entire circle wave V could have ended there, hence consolidation with mild upside bias is seen for major correction to take place, bring initial test of 1.5547 (previous 4th of a lesser degree).
On the downside, whilst initial pullback to 1.2460-65 cannot be ruled out, reckon support at 1.2440-45 would limit downside and bring another rise later. Below 1.2355-60 would defer and risk test of said support at 1.2285 but only break there would revive bearishness and suggest the rebound from 1.2215 has ended instead, bring retest of this support first. A break of 1.2215 would signal the erratic fall from 1.2915 has resumed and extend weakness to previous support at 1.2102 which is likely to hold on first testing. Looking ahead, only a break below this level would extend the fall from 1.2915 to 1.2000-10 and later towards previous support at 1.1962 but reckon key support at 1.1899 would contain downside.
Recommendation: Stand aside for this week.
On the Monthly chart, the longer-term count is that major downtrend is under way with circle wave I at 2.8645 (Sep 1.978), then wave II with circle at 4.6175 (Feb 1981), the wave III with circle ended at 1.7425 (Nov 1995) and followed by wave IV with circle at 2.4965 (July 2007 with a short wave C) and wave V with circle has possibly ended at 0.9106. A monthly close above 1.5547 would add credence to this view, bring major correction to 1.7000, then towards psychological level at 2.0000.