GBP/JPY – 137.65
GBP/JPY – Wave 5 as well as wave (III) has possibly ended at 116.85
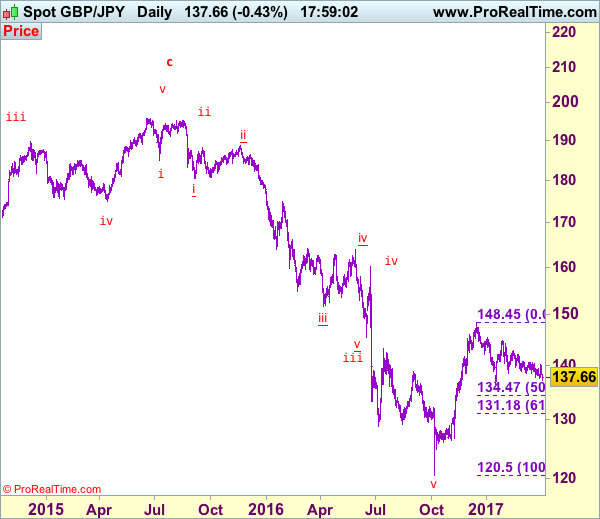
As sterling has fallen again after faltering below resistance at 140.60, dampening our near term bullishness and near term downside risk remains for the fall from 144.75 to bring a stronger retracement of early upmove from 120.50 to 136.45-50, break there would add credence to this view and extend fall to 135.90-00, then towards 134.45-50 (50% Fibonacci retracement of 120.50-148.45) which is likely to hold on first testing, risk from there is seen for a rebound to take place later.
Our preferred count is that larger degree wave V with circle is unfolding from 251.12 with wave (I) 219.34, (II): 241.38 and wave (III) is subdivided into 1: 192.60, 2: 215.89 (23 Jul 2008) and wave 3 ended at 118.87 earlier in 2009. The correction from there to 162.60 is wave 4 which itself is a double three and is labeled as first a-b-c ended at 151.53, followed by wave x at 139.03, 2nd a ended at 162.60, 2nd b at 146.75 and 2nd c leg of wave 4 ended at 163.00. Therefore, the decline from 163.00 to 116.85 is now treated as wave 5 which also marked the end of larger degree wave (III), hence wave (IV) major correction has commenced for retracement of the wave (III) from 241.38 and upside target at 183.95-00 (50% Fibonacci retracement of the wave (II) from 241.38) had been met, a drop below 160.00 would suggest wave (IV) has ended at 195.85, bring decline in wave (V) for initial weakness to 130 (already met) and 120.
On the upside, whilst recovery to 138.35-40 cannot be ruled out, reckon upside would be limited to 139.00-10 and resistance at 140.10 (last week’s high) should hold, bring another decline later. Only break of indicated resistance at 140.60 would revive bullishness and suggest low is formed, bring a stronger rebound to 142.00-05 but only break of resistance at 142.80 would signal the fall from 144.75 has ended, bring further gain to 143.40-50 first.
Recommendation: Stand aside for this week.
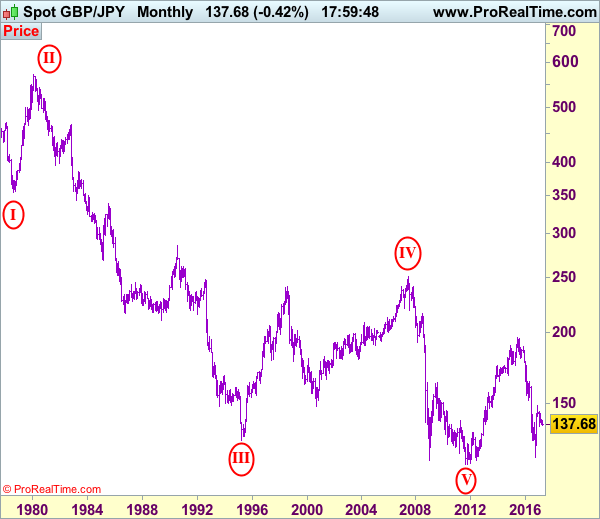
The long-term downtrend from 570.99 (29 Feb 1980) is labeled as an impulsive wave with III with circle ended at 129.77 (20 Apr 1995) and the corrective rebound to 251.12 (20 Jul 2007) is treated as wave IV with circle and the wave V with circle selloff from 251.12 has possibly ended at 116.80 (almost reached our indicated target at 116.00) and major correction has commenced from there and indicated upside target at 183.90-00 (50% Fibonacci retracement of 251.10-116.85) had been met, reckon upside would be limited to 199.80-90 (61.8% Fibonacci retracement) and bring wave (V) decline in later part of 2017.