EUR/JPY – 119.52
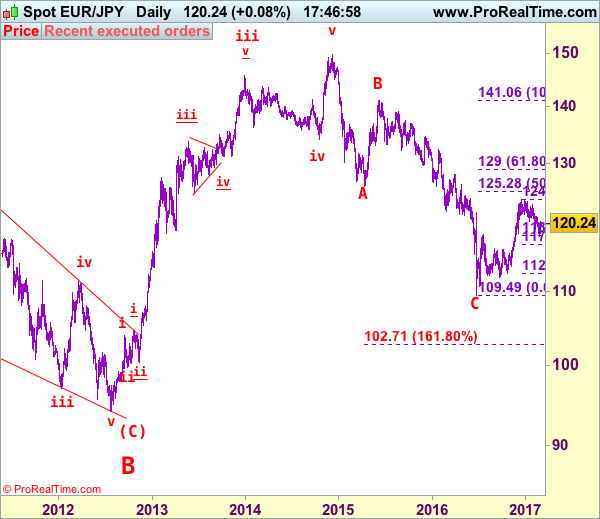
EUR/JPY: Wave v as well as larger degree wave (C) ended at 94.11 and first leg of larger degree wave C upmove has possibly ended at 149.79 and wave 2 correction has possibly ended at 109.49.
The single currency only recovered to 120.44 (we recommended in our previous update to sell at 120.50 and missed the short entry) before meeting renewed selling interest and price has dropped again, adding credence to our view that the fall from 122.89 top (last week’s high) is still in progress, this move also signal the rebound from 118.24 has ended at 122.89, hence downside risk remains for further weakness to 118.75-80, however, still reckon said support at 118.24 would remain intact and bring another rebound later. Looking ahead, only a break below said support at 118.24 would retain bearishness and signal the erratic decline from 124.10 top has resumed for further fall to 117.50-60 and later towards 117.00 (61.8% Fibonacci retracement of 112.61-124.10) but downside should be limited to 116.00.
The daily chart is labeled as attached, early selloff from 169.97 (July 2008) to 112.08 is wave (A) of B instead of end of entire wave B and then the rebound from there to 139.26 is wave (B), hence, wave (C) has possibly ended at 94.12 with a diagonal triangle as labeled in the daily chart, hence upside bias is seen for further gain. Recent rally above indicated retracement level at 116.69 (50% Fibonacci retracement of the intermediate fall from 139.26-94.12) adds credence to this view and signal major reversal has commenced but first leg of this wave C has possibly ended at 149.79, hence wave 2 has commenced with wave A ended at 126.09, followed by wave B at 141.06, wave C commenced and could have ended at 109.49, above 125.00 would add credence to this view.
On the upside, although initial recovery to 119.90-00 cannot be ruled out, reckon upside would be limited to said resistance at 120.44 and bring another decline later. Only above indicated resistance at 121.84 would abort and signal the retreat from 122.89 has ended instead, bring further gain to 122.25-30, however, as broad outlook remains consolidative, reckon upside would be limited and said resistance at 122.89 would remain intact.
Recommendation: Sell euro at 120.40 for 118.50 with stop above 121.40.
To re-cap the corrective upmove from the record low of 88.93 (18 Oct 2000), the wave A from there is subdivided as: 1:88.93-113.72, 2:99.88 (1 Jun 2001), 3:140.91 (30 May 2003), 4:124.17 (10 Nov 2003) and 5 ended at record high of 169.97 (21 Jul 2008). The brief but sharp selloff to 112.08 is viewed as a-b-c x a-b-c wave (A) of B. The subsequent rebound to 139.26 is (B) of B and (C) of (B) has possibly ended at 94.12 and in any case price should stay well above previous chart support at 88.93, bring rally in larger degree wave C towards 150.00.