EUR/CHF : 1.1327
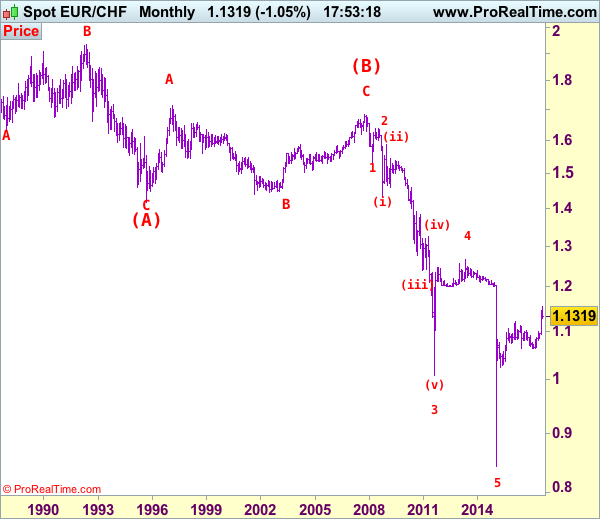
EUR/CHF: Major wave 5 trough ended at 0.8426 and correction has commenced from there for subsequent gain towards 1.1400-1.1500.
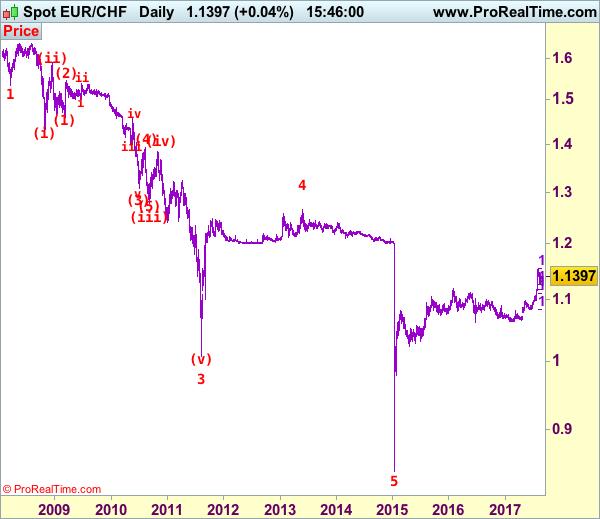
Although the single currency met renewed selling interest at 1.1479 and slipped again week, lack of follow through selling on break of support at 1.1261 and the subsequent rebound from 1.1259 suggest the correction from 1.1538 (i.e. wave iv) has possibly ended there, hence consolidation with upside bias is seen for another test of said resistance at 1.1479 but a daily close above there is needed to add credence to this view, bring retest of this recent high. Looking ahead, a break of this resistance at 1.1538 (wave iii top) is needed to confirm upmove has resumed in wave v to 1.1600, then towards 1.1700-10.
To recap our preferred count, the decline from 1.6828 (end wave (B)) is labeled as the beginning of wave (C) which should unfold as an impulsive move with 1: 1.5326, 2: 1.6377 and wave 3 is sub-divided into (i): 1.4300, (ii): 1.5880 and wave (iii) is still unfolding with (1): 1.4577, (2): 1.5448 and wave (3) is an extended 3rd with i: 1.5006, ii: 1.5383, wave iii: 1.3073, then wave iv ended at 1.3925 and wave v at 1.3073, wave (4) ended at 1.3925 and wave (5) has ended at 1.2765 which also marked the low of wave (iii) and wave (iv) has ended at 1.3835 and wave (v) as well as larger degree wave 3 has ended at 1.0075. The selloff from 1.2650 signals wave 4 has ended there and we are taking a view that the wave 5 could also have ended 0.8426, hence consolidation is seen with mild upside bias for rebound to 1.1400 (already met), then towards 1.1600.
On the downside, whilst initial pullback to 1.1370-80 is likely, reckon 1.1325-30 would limit downside and bring another rise later. Below said support at 1.1259 would defer and signal the wave iv correction is still in progress (probably a complex one), bring retracement of recent upmove to 1.1185-90 (50% Fibonacci retracement of 1.0833-1.1538), however, reckon downside would be limited to 1.1100-05 (61.8% Fibonacci retracement of 1.0833-1.1538), bring upmove in wave v later (probably in late Q3). Only a drop below previous resistance at 1.0988 (wave i top) would abort and signal recent upmove has ended, bring correction to 1.0950, then 1.0900 but support at 1.0833 should remain intact.
Recommendation: Buy again at 1.1330 for 1.1530 with stop below 1.1230.
The long-term downtrend started from 1.9626 (Apr 1985) to 1.4166 (Sep 1995) is treated as wave (A) with A:1.6285 (Dec 1987), B: 1.9342 (May 1992) and C: 1.4166, then wave (B) ended at 1.6828 with A: 1.7147 (Feb 1997), B: 1.4398 (Sep 2001), C: 1.6828 (Nov 2007), therefore, wave (C) is now in progress with the breakdown indicated as above. This wave (C) already met indicated downside target at 1.1455/60 and 1.1300, it could have ended at 0.8426, consolidation with mild upside bias is seen for gain to 1.1000 and later towards 1.2000.