USD/CAD – 1.3280
USD/CAD – Wave v ended at 0.9407 and a-b-c correction may extend gain to 1.4700
The greenback finally dropped in line with our bearish expectation, our short position entered at 1.3530 finally met our downside target at 1.3330 with 200 points profit, this anticipated selloff adds credence to our view that top has been formed at 1.3794 and the breach of previous support has reinforced our view that the rebound from 1.2969 ha ended at 1.3794, then further weakness to 1.3150 and then 1.3100 would be seen, however, oversold condition should limit downside and reckon previous support at 1.3056 would hold, price should stay above psychological support at 1.3000.
We are keeping our view that the wave b from 1.0657 (a leg top) has possibly ended at 0.9633 with (a): 0.9800, wave (b): 1.0447 and wave c at 0.9633, the subsequent rise from there is now treated as wave c exceeded indicated upside target at 1.3770-80 and 1.4000 and wave (3) has possibly ended at 1.4690 and wave (4) correction has commenced for retracement back to 1.2832 support, then 1.2410-20.
On the daily chart, our latest preferred count remains that the A of (B) rally from 0.9059 low (7 Nov 2007) unfolded into an impulsive wave with i: 0.9059-1.0380, ii ended at 0.9819, iii at 1.3019 followed by triangle wave iv at 1.2026 , then wave v formed a top at 1.3066 and also ended the wave A. The wave B is unfolding as an double three a-b-c-x-a-b-c and is sub-divided as a: 1.2192, b: 1.2716 and wave c at 1.0784, followed by wave x at 1.1725, another set of a-b-c unfolded with 2nd a at 0.9931, 2nd b at 1.0674. the 2nd c has possibly ended at 0.9407, therefore, consolidation with upside bias is seen for major correction, indicated target at 1.3900 had been met and gain to 1.4700 would follow.
On the upside, whilst initial recovery to 1.3310-15 cannot be ruled out, reckon upside would be limited to 1.3350 and previous support at 1.3387 (now resistance) should hold, bring another decline. A daily close above 1.3387 would suggest low is possibly formed, bring a stronger rebound to 1.3425-30, break there would add credence to this view, then further gain to 1.3490-00 would follow but resistance at 1.3547 should remain intact.
Recommendation: Short entered at 1.3530 met target at 1.3330 with 200 points profit an d would stand aside for this week.

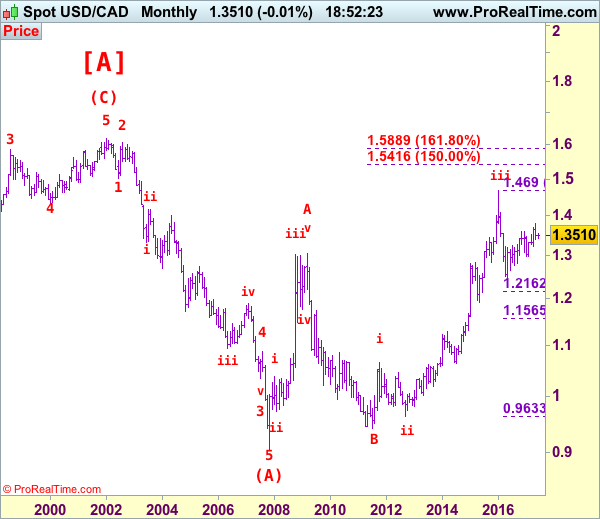
Longer term – The selloff from 1.6194 (21 Jan 2002) to 0.9059 (07 Nov 2007) is viewed as (A) wave which is a 5-waver as labeled on the monthly chart as below, the subsequently rally is labeled as (B) with impulsive A leg of (B) ended at 1.3066, wave B of (B) is unfolding which has either ended at 0.9407 or would extend one more fall but downside should be limited to 0.9200 and 0.9000 should hold.