EUR/CAD – 1.5010
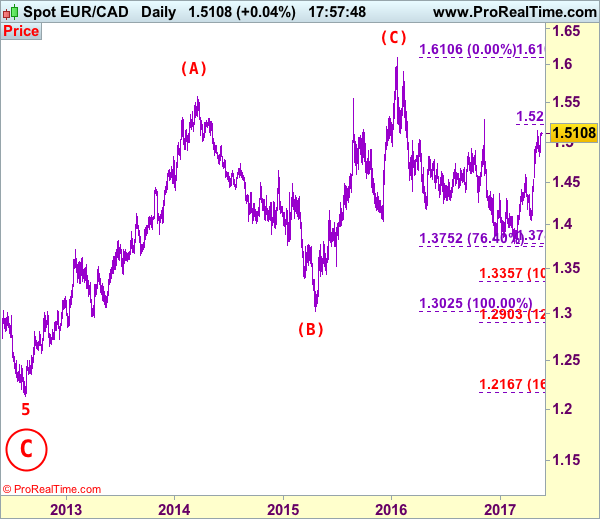
EUR/CAD: Wave 4 ended at 1.4380 and wave 5 as well as circle wave C has possibly ended at 1.2129, major (A)-(B)-(C) correction has commenced and indicated target at 1.6000 had been met.
The single currency only retreated to 1.4825 last week before finding renewed buying interest (we recommended in our previous update to buy at 1.4770) and the pair has surged again since, adding credence to our bullish view that the rise from 1.3784 low is still in progress, above resistance at 1.5153 resistance would extend gain to 1.5215-20 (61.8% Fibonacci retracement of 1.6106-1.3784), then towards previous resistance at 1.5282, however, loss of upward momentum should prevent sharp move beyond 1.5350 and price should falter well below 1.5500, risk from there is seen for a retreat later.
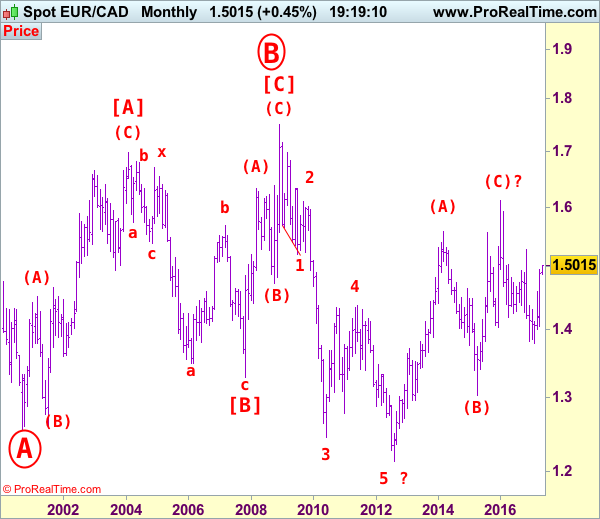
Our latest preferred count is that larger degree wave [C] from 1.3289 as well as circle wave B ended at 1.7509 in Dec 2008 with (A): 1.6325, (B): 1.4719 followed by wave (C) at 1.7509, hence circle wave C is unfolding with wave 1 ended at 1.5186 (diagonal wave 1), wave 2 at 1.6096, impulsive wave 3 has ended at 1.2451, followed by wave 4 at 1.4380, in view of recent strong rebound, we are now treating the wave 5 as well as larger degree circle wave C has ended at 1.2129, hence (A)-(B)-(C) correction has commenced from there with impulsive wave (C) now unfolding and indicated initial upside target at 1.6000 had been met and reckon 1.6500 would hold.
On the downside, whilst pullback to 1.5050-60 cannot be ruled out, reckon downside would be limited to 1.5000 and bring another rise later. Below 1.4900 would defer and prolong consolidation, risk another corrective fall to 1.4825, break there would bring correction to 1.4750-60, however, downside should be limited to 1.4690-00 and price should stay we above previous resistance at 1.4600 (wave i top), bring another rally later.
Recommendation: Buy at 1.5000 for 1.5250 with stop below 1.4900.
On the bigger picture, our long-term count on the monthly chart is that a big sideways consolidation from 2000 low of 1.2557 has possibly ended at 1.7509 as circle wave B with [A]: 1.6976 ( (A): 1.4513, (B): 1.2612, (C): 1.6976), wave [B]: 1.3289 is a double three with 1st a-b-c: 1.5384, x: 1.6709 and 2nd a-b-c: 1.3289. As indicated above, the wave [C] has ended at 1.7509. The selloff from there is now unfolding which itself should be labeled as an impulsive wave with wave 1: 1.5186 (diagonal wave 1), followed by wave 2: 1.6096 and wave 3: 1.2451, wave 4: 1.4380, wave 5 as well as larger degree circle wave C has possibly ended at 1.2129 and major correction has possibly commenced for retracement of recent decline towards 1.4000, then 1.4180-90 (38.2% Fibonacci retracement of 1.7509-1.2129). Below said support at 1.2129 would risk weakness to psychological support at 1.2000 and then 1.1851 (50% projection of 1.7509-1.2451 measuring from 1.4380) but reckon 1.1500 would remain intact, bring reversal later.