EUR/GBP – 0.8422
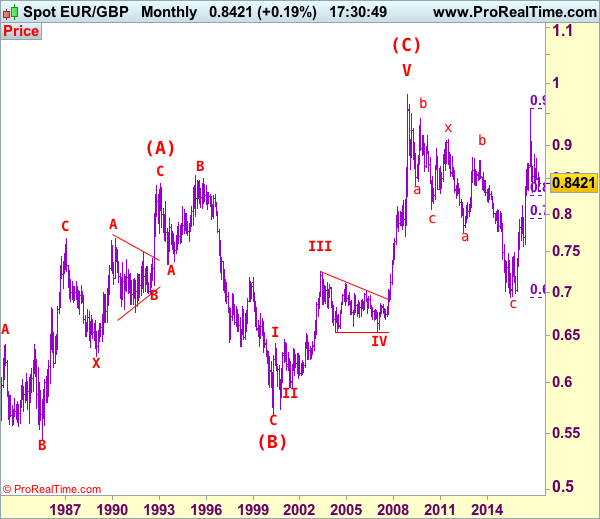
EUR/GBP – The major (A)(B)(C)-(X)-(A)(B)(C) correction from 0.9805 is unfolding and 2nd (A) has possibly ended at 0.6936.
As the single currency retreated after meeting resistance at 0.8531 late last month, suggesting consolidation with mild downside bias would be seen and initial weakness to 0.8360-65 cannot be ruled out, however, as long as support at 0.8312 holds, prospect of another rebound remains, above 0.8509 (last week’s high) would bring test of 0.8531 but break there is needed to retain bullishness and signal low is formed at 0.8312, bring a stronger rebound to 0.8592, break there would signal the fall from 0.8857 has ended instead, bring further subsequent gain to 0.8650-60 and possibly towards resistance at 0.8735 but price should falter well below resistance at 0.8788.
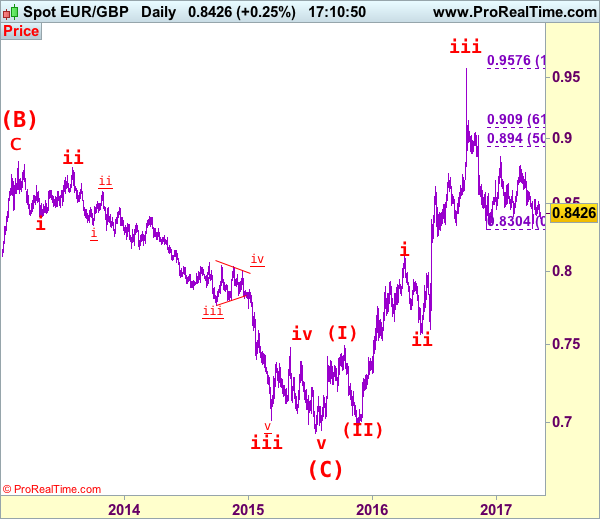
Our latest preferred count is that the wave V of a 5-wave series from 0.5682 ended at 0.9805 earlier and major from there has possibly ended at 0.8067 as A-B-C-X-A-B-C. We are keeping our view that the entire correction from 0.9805 has possibly ended at 0.7756 and as labeled as the attached daily chart and impulsive move from 0.9084 has ended at 0.7756 as a 5-waver which marked either the (C) wave or the A leg of (C), a daily close above resistance at 0.8831 would suggest (C) leg has ended and headway towards 0.9084.
On the downside, whilst the pullback from 0.8531 may bring initial weakness to 0.8360-65, reckon downside would be limited and said support at 0.8312 should hold, bring another rebound later. A drop below 0.8351 support would signal the rebound from 0.8312 has ended but only break of said support at 0.8304 would revive bearishness and indicate early decline from 0.9576 top (2016 high) has resumed for weakness to 0.8251 support, then 0.8200.
Recommendation: Stand aside for this week.
Euro’s long term uptrend started in Feb 1981 at 0.5039 and is unfolding as a (A)-(B)-(C) move with (A): 0.8433 (Feb 1993), (B): 0.5682 (May 2000) and impulsive wave (C) should have ended at 0.9805 with wave III ended at 0.7254 (May 2003), triangle wave IV at 0.6536 (23 Jan 2007) and wave V as well as wave (C) has ended at 0.9805.
We are keeping an alternate count that only wave III ended at 0.9805 and the correction from there is the wave IV and may extend weakness to 0.7700, however, it is necessary to see a daily close above resistance at 0.9143 would change this to be the preferred count.