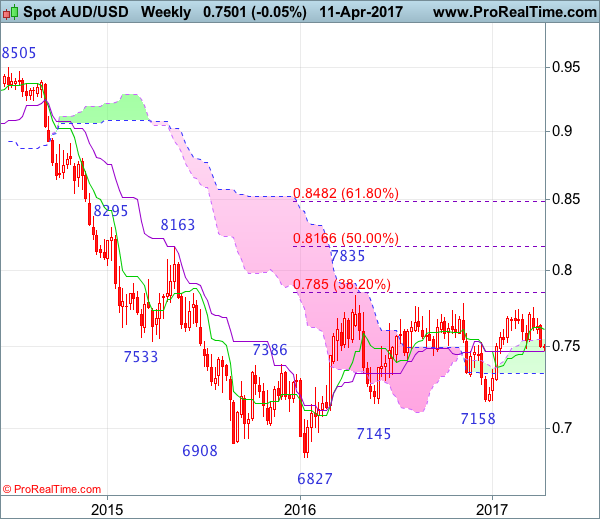
Weekly
• Last Candlesticks pattern: Shooting doji
• Time of formation: 20 Feb 2017
• Trend bias: Sideways
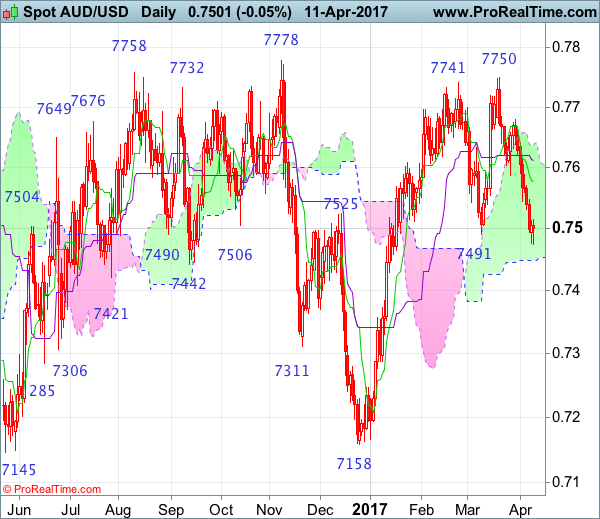
Daily
• Last Candlesticks pattern: Bearish engulfing pattern
• Time of formation: 21 Mar 2017
• Trend bias: Near term down
Aussie has dropped quite sharply last week and broke below indicated support at 0.7491, dampening our bullishness and suggesting top has been formed at 0.7750 last month, hence consolidation with downside bias is seen for this fall from 0.7750 to bring at least a strong retracement of the rise from 0.7158 and further decline to 0.7450-55 (50% Fibonacci retracement of 0.7158-0.7750), then towards 0.7380-85 (61.8% Fibonacci retracement), however, reckon downside would be limited to 0.7300-10 and bring rebound later.
On the upside, whilst initial recovery to 0.7540-50 cannot be ruled out, reckon the Tenkan-Sen (now at 0.7569) would limit upside and bring another decline later. Only a daily close above the Kijun-Sen (now at 0.7612) would abort and signal first leg of decline from 0.7750 has ended, bring a stronger rebound to 0,7640-50 but resistance at 0.7680 should cap upside, price should falter below 0.7700-10, bring another decline later.
Recommendation: Sell at 0.7570 for 0.7390 with stop above 0.7670.
On the weekly chart, last week’s selloff below support at 0.7491 formed a black candlestick with price closing near the week’s low, signaling top has been formed at 0.7750 and consolidation with downside bias is seen, a weekly close below the Kijun-Sen (now at 0.7468) would add credence our view that the rebound from 0.7158 has ended at 0.7750, then further choppy trading below previous resistance at 0.7778 would take place with mild downside bias for further fall towards 0.7380-85 (61.8% Fibonacci retracement of 0.7158-0.7750), however, reckon downside would be limited to 0.7290-00, bring recovery later.
On the upside, expect recovery to be limited to 0.7565-70 and the Tenkan-Sen (now at 0.7612) should hold, bring another decline later. Above last week’s high at 0.7641 would risk test of resistance at 0.7680 but only a sustained breach above this level would signal the retreat from 0.7750 has ended instead, bring another bounce towards this level. Looking ahead, only break of 0.7778 resistance would suggest a possible upside break of early established broad range, bring further rise to 2016 high at 0.7835, above there would confirm and encourage for headway to 0.7900 and later towards psychological level at 0.8000.