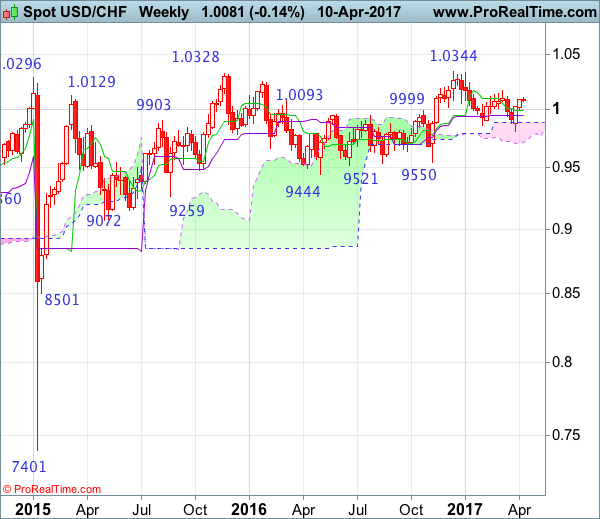
Weekly
• Last Candlesticks pattern: Doji
• Time of formation: 26 Sep 2016
• Trend bias: Sideways
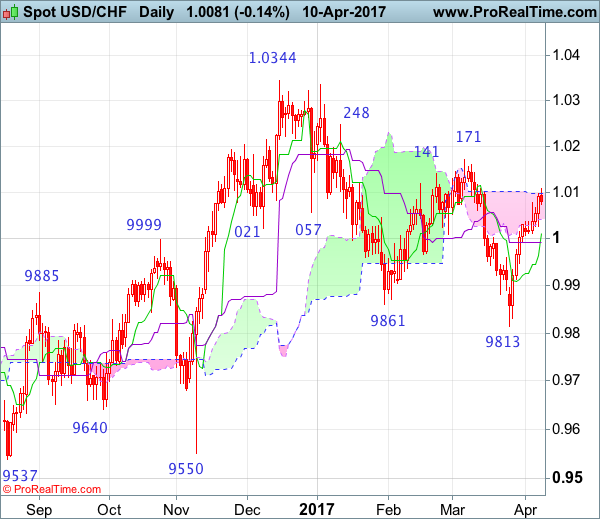
Daily
• Last Candlesticks pattern: Shooting star
• Time of formation: 25 Oct 2016
• Trend bias: Near term up
USD/CHF – 1.0080
As the greenback has maintained a firm undertone after recent rally, adding credence to our view that low has been formed at 0.9813 last month and bullishness remains for the rise from there to extend gain towards resistance at 1.0171, however, a sustained breach above there is needed to add credence to our view that the erratic decline from 1.0344 top has ended at 0.9813, bring further rise to 1.0200-10, then 1.0250 but price should falter well below said resistance at 1.0344 (2016 high).
On the downside, whilst initial pullback to 1.0040-45 and possibly the Tenkan-Sen (now at 1.0011) cannot be ruled out, reckon the Kijun-Sen (now at 0.9992) would contain downside and bring another rise later. Below 0.9890-00 would abort and signal the rebound from 0.9813 has ended, bring another fall to this level. Looking ahead, only a drop below said support at 0.9813 would revive bearishness and signal the decline from 1.0344 top has resumed instead and extend further fall to 0.9735-40 (76.4% retracement of 0.9550-1.0344) and later towards 0.9700 but reckon 0.9650-60 would hold.
Recommendation: Buy at 0.9990 for 1.0190 with stop below 0.9890.
On the weekly chart, as the greenback continued moving higher after staging a strong rebound from 0.9813, another white candlestick was formed, adding credence to our view that low has been formed at 0.9813 last month and consolidation with mild upside bias remains for further gain to resistance at 1.0171, however, a weekly close above this level is needed to confirm the fall from 1.0344 top has ended at 0.9813, bring further subsequent rise towards key resistance at 1.0248. A sustained breach above this level would signal early upmove has possibly resumed, bring test of 1.0335-44 resistance area, above there would provide confirmation and headway to 1.0400-10 and later 1.0500 would follow.
On the downside, expect pullback to be limited to the Tenkan-Sen (now at 0.9992) and bring another rise later. A drop below the Kijun-Sen (now at 0.9947) would bring weakness to 0.9890-00 but only below said support at 0.9813 would abort and signal the erratic fall from 1.0344 top is still in progress, bring further decline for retracement of early upmove to 0.9735-40, then towards the lower Kumo (now at 0.9712) but reckon downside would be limited to 0.9640-50 and price should stay well above support at 0.9550.