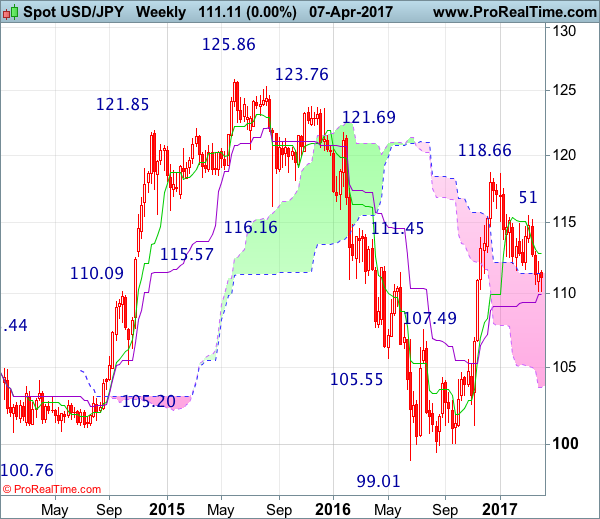
Weekly
• Last Candlesticks pattern: Marubozu
• Time of formation: 14 Nov 2016
• Trend bias: Down
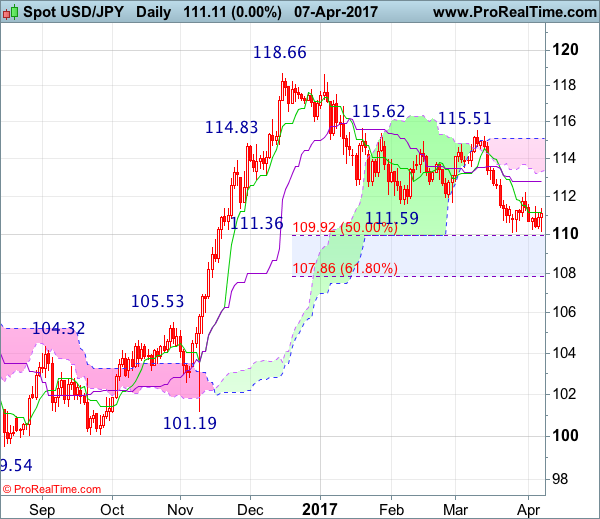
Daily
• Last Candlesticks pattern: Shooting star
• Time of formation: 15 Feb 2017
• Trend bias: Down
USD/JPY – 111.39
Although the greenback fell to as low as 110.13 late last week, as dollar has rebounded again after holding above indicated previous support at 110.11, suggesting further consolidation would take place and another bounce to 111.65-70 cannot be ruled out, however, as long as resistance at 112.20 holds, prospect of another decline remains, below said support at 110.11-13 would confirm downtrend from 118.66 has resumed and extend weakness to 109.90-95 (50% Fibonacci retracement of 101.19-118.66), then 109.50, however, downside would be limited to 109.00 and previous support at 108.55 should hold from here, price should stay well above dynamic support at 107.85-90 (61.8% Fibonacci retracement of 101.19-118.66) and bring rebound later.
On the upside, expect recovery to be limited to 111.65-70 and bring another decline. Above previous support at 112.26 (now resistance) would risk test of 112.81-90 (current level of the Kijun-Sen and previous resistance) but a daily close above there is needed to signal low is possibly formed, risk a stronger rebound to 113.54 resistance, a break above there would add credence to this view, then further gain to 114.00-10 would follow.
Recommendation : Hold short entered at 111.50 for 109.50 with stop above 112.30.
On the weekly chart, as the greenback has recovered again after finding support around the Kijun-Sen (now at 109.79), suggesting minor consolidation above this level would be seen, however, reckon upside would be limited to 112.26 (previous support) would limit upside and bring another decline later, below 109.90-95 (50% Fibonacci retracement of 101.19-118.66) would extend the retreat from 118.66 to 109.00 but reckon support at 108.55 would limit downside and price should stay above 107.85-90 (61.8% Fibonacci retracement), risk from there is seen for a rebound later.
On the upside, although initial recovery cannot be ruled out, reckon upside would be limited to 112.00-10 and bring another decline. Above previous support at 112.26 (now resistance) would defer and suggest a temporary low is formed, bring test of the Tenkan-Sen (now at 112.81), a weekly close above there would add credence to this view, then further gain to 113.54 resistance and then 114.00-10 would follow but price should falter well below resistance at 115.51.