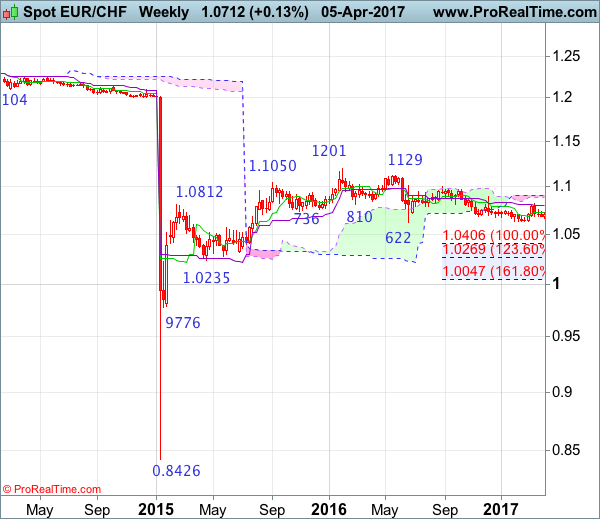
Weekly
• Last Candlesticks pattern: Doji
• Time of formation: 20 Feb 2017
• Trend bias: Up
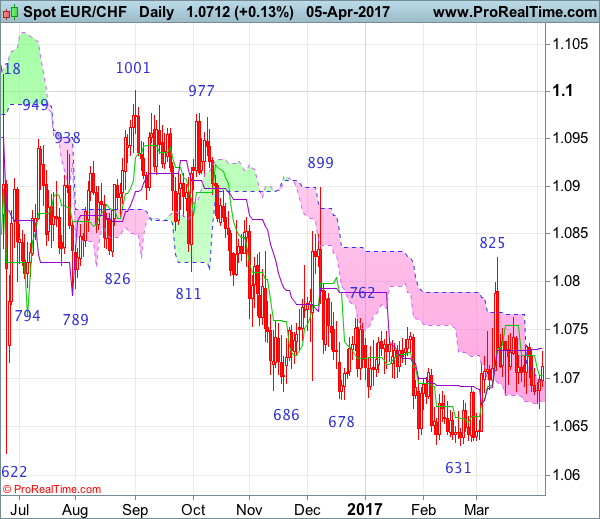
Daily
• Last Candlesticks pattern: Doji
• Time of formation: 1 Sep 2016
• Trend bias: Near term down
EUR/CHF – 1.0713
Although the single currency fell briefly to 1.0669 earlier this week, lack of follow through selling and current strong rebound suggest consolidation above this level would be seen and upside risk is seen for test of resistance at 1.0736, however, break of 1.0763 is needed to signal the retreat from 1.0825 (last month’s high) has ended, bring further gain to 1.0790-00 but said resistance at 1.0825 should remain intact. In the event euro is able to penetrated resistance at 1.0825, this would shift risk back to upside and signal low has been formed instead, bring further subsequent gain to 1.0850 and later towards key resistance at 1.0899 (Dec high).
On the downside, below said support at 1.0669 would revive bearishness and suggest the fall from 1.0825 is still in progress, bring further fall towards 1.0622-31, however, break of this level is needed to signal the decline from 1.1201 (2016 high) has resumed and extend further fall to 1.0590-00, then towards 1.0530-35 but loss of downward momentum should prevent sharp fall below 1.0500, price should stay well above 1.0400-10, risk from there has increased for a strong rebound to take place later.
Recommendation: Exit short entered at 1.0725 and stand aside for this week.
On the weekly chart, as the single currency found good support at 1.0669 and has rebounded, a white candlestick looks set to be formed this week, suggesting consolidation above this level would be seen and recovery to 1.0760-65 cannot be ruled out, however, reckon upside would be limited to 1.0825 resistance and bring further consolidation. Only a break of 1.085 would signal low has been formed at 1.0631, bring retracement of recent decline to 1.0850 but a break above indicated resistance at 1.0899 is needed to add credence to this view and bring a stronger rebound to 1.0970-75, then test of 1.1001. Looking ahead, only a sustained breach above 1.1001 would signal the fall from 1.1201 has ended, bring further gain to 1.1100 but reckon resistance at 1.1129 would hold on first testing.
On the downside, below 1.0669 would bring another test of indicated strong support at 1.0622-31, however, break there is needed to signal recent decline from 1.1201 top has resumed and extend further fall to 1.0550-55, then 1.0500-10 but oversold condition should prevent sharp fall below 1.0400-10 (100% projection of 1.1201-1.0622 measuring from 1.1001) and price should stay well above previous support at 1.0314, risk from there is seen for a rebound to take place later.