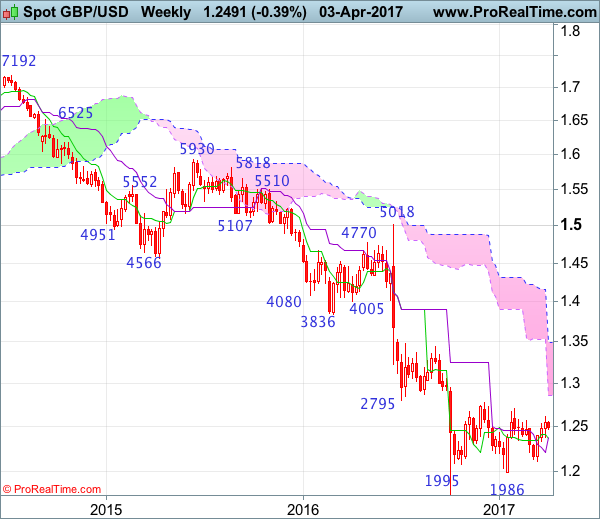
Weekly
• Last Candlesticks pattern: Shooting star
• Time of formation: 5 Sep 2016
• Trend bias: Down
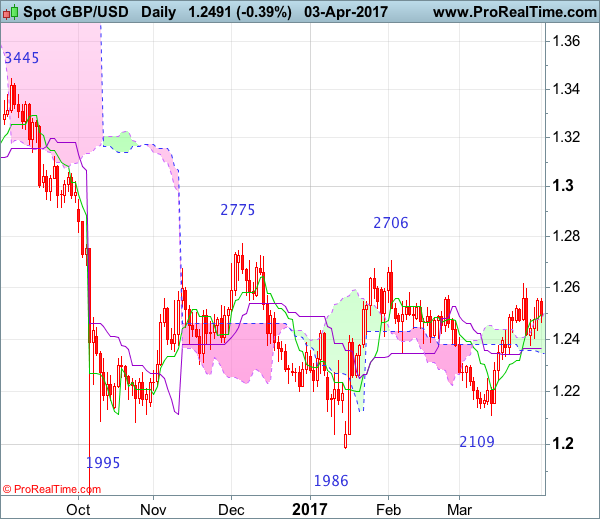
Daily
• Last Candlesticks pattern: Long black candlestick
• Time of formation: 24 Jun 2016
• Trend bias: Down
GBP/USD – 1.2478
Although the British pound slipped to as low as 1.2377 last week, the subsequent rebound on cross-trading in sterling suggests consolidation would be seen, however, as cable met resistance at 1.2559 late last week and has retreated again, suggesting weakness to 1.2433 cannot be ruled out but said support at 1.2377 should continue to hold, bring further sideways trading. Only a drop below said support at 1.2377 would signal the retreat from 1.2616 top is still in progress, bring further fall to previous support at 1.2335, once this level is penetrated, this would signal the rise from 1.2109 has ended, then weakness to 1.224050 would follow.
On the upside, whilst recovery to 1.2530-35 cannot be ruled out, reckon said last week’s high at 1.2559 would limit upside and bring further consolidation. Only a daily close above this level would revive bullishness and suggest the retreat from 1.2616 has ended, bring further gain to 1.2595-00, then retest of said resistance, break there would extend the rise from 1.2109 to 1.2650, however, as broad outlook remains consolidative, reckon upside would be limited and price should falter well below indicated previous resistance at 1.2706, bring retreat later. In the event cable is able to penetrate resistance at 1.2706, this would retain bullishness and extend the erratic rise from 1.1986 low towards another previous resistance at 1.2775 first.
Recommendation: Exit long entered at 1.2470 and stand aside for this week.
On the weekly chart, although cable recovered after finding support at 1.2377, early retreat from 1.2616 suggests the rebound from 1.2109 has possibly ended there and consolidation with mild downside bias is seen for weakness to 1.2400 and then test of 1.2377, however, a break below 1.2335 is needed to add credence to this view, bring further fall to 1.2240-50, then 1.2200. Looking ahead, a drop below 1.2109 support is needed to retain bearishness and suggest medium term downtrend has resumed for weakness towards recent low at 1.1986.
On the upside, expect recovery to be limited to 1.2530-35 and last week’s high at 1.2559 should hold, bring another decline. Above said resistance at 1.2559 would bring rebound to 1.2616, break there would revive previous near term bullish view that another leg of corrective rise from 1.1986 low take place and extend gain to 1.2706 resistance but break there is needed to provide confirmation, bring retracement of early downtrend for test of previous resistance at 1.2775 and later 1.2850-60 but price should falter well below psychological resistance at 1.3000.