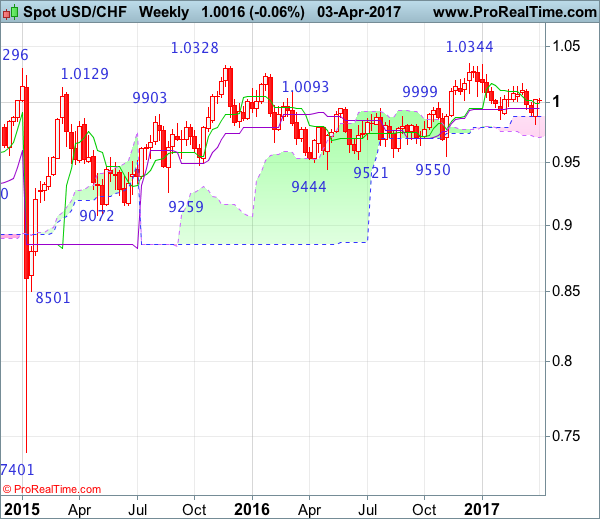
Weekly
• Last Candlesticks pattern: Doji
• Time of formation: 26 Sep 2016
• Trend bias: Sideways
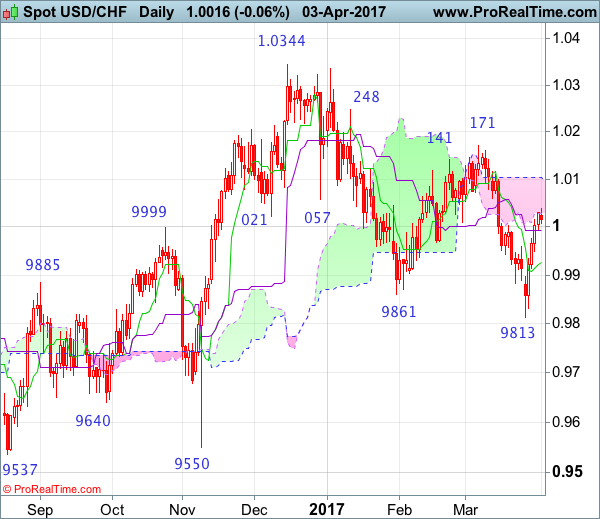
Daily
• Last Candlesticks pattern: Shooting star
• Time of formation: 25 Oct 2016
• Trend bias: Near term up
USD/CHF – 0.9861
Although the greenback opened lower initially last week and fell to as low as 0.9813, as dollar found decent demand there and staged a much stronger-than-expected rebound, suggesting recent erratic decline from 1.0344 top has possibly ended there and consolidation with mild upside bias is seen for further gain towards the upper Kumo (now at 1.0103), however, a daily close above resistance at 1.0171 is needed to add credence to this view and encourage for subsequent rise to 1.0200-10, otherwise, further choppy trading is in store.
On the downside, whilst pullback to the Kijun-Sen (now at 0.9992) cannot be ruled out, reckon downside would be limited to 0.9950-60 and the Tenkan-Sen (now at 0.9926) should hold, bring another rebound later. Below 0.9840-50 would risk retest of said support at 0.9813 but only break there would revive bearishness and signal the decline from 1.0344 top is still in progress for further fall to 0.9735-40 (76.4% retracement of 0.9550-1.0344) and later towards 0.9700 but oversold condition should limit downside to 0.9650-60, bring rebound later.
Recommendation: Buy at 0.9950 for 1.0150 with stop below 0.9850.
On the weekly chart, although the greenback fell briefly below previous support at 0.9861, lack of follow through selling and the subsequent strong rebound from 0.9813 formed a long white candlestick with a long lower shadow, suggesting low is possibly formed there and consolidation with mild upside bias is seen for further gain to 1.0060 and then 1.0085-90, however, break of resistance at 1.0171 is needed to signal the fall from 1.0344 top has ended at 0.9813, bring further subsequent rise towards key resistance at 1.0248. A sustained breach above this level would signal early upmove has possibly resumed, bring test of 1.0335-44 resistance area, above there would provide confirmation and headway to 1.0400-10 and later 1.0500 would follow.
On the downside, expect pullback to be limited to the Kijun-Sen (now at 0.9947) and bring another rebound. Only below said support at 0.9813 would abort and signal the erratic fall from 1.0344 top is still in progress, bring further decline for retracement of early upmove to 0.9735-40, then towards the lower Kumo (now at 0.9706) but reckon downside would be limited to 0.9640-50 and price should stay well above support at 0.9550.