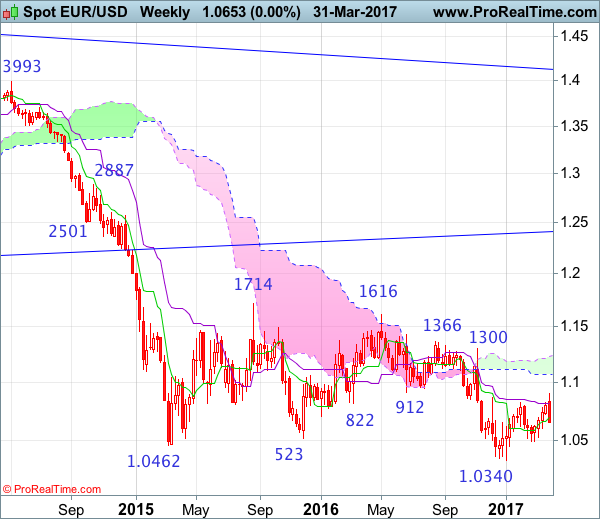
Weekly
• Last Candlesticks pattern: Shooting star
• Time of formation: 03 May 2016
• Trend bias: Down
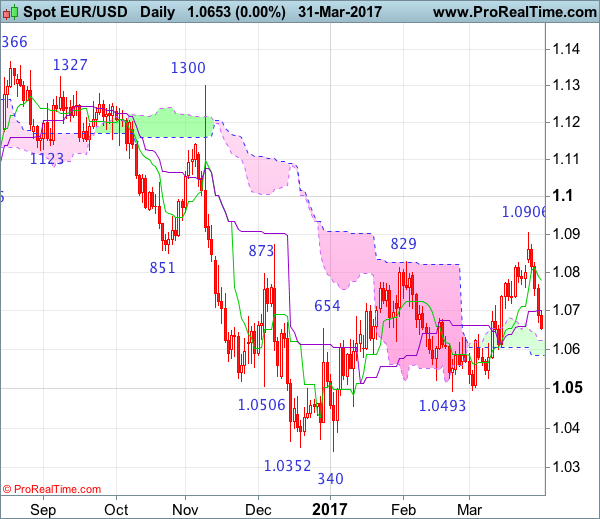
Daily
• Last Candlesticks pattern: Shooting star
• Time of formation: 3 May 2016
• Trend bias: Sideways
EUR/USD – 1.0868
Despite last week’s initial brief rise to 1.0906, lack of follow through buying and the subsequent much stronger-than-expected retreat formed a series of black candlesticks, suggesting top has indeed been formed at 1.0906 and downside risk remains for the fall from there to extend weakness towards support at 1.0600 but a daily close below there is needed to retain bearishness, bring test of the lower Kumo (now at 1.0585) and later towards support at 1.0525 but price should stay above pivotal support at 1.0493, bring rebound later due to near term oversold condition.
On the upside, whilst initial recovery to the Kijun-Sen (now at 1.0701) cannot be ruled out, price should falter well below the Tenkan-Sen (now at 1.0779) and bring another decline later. A daily close above the Tenkan-Sen would dampen this bearish view and suggest the fall from 1.0906 has ended instead, risk a stronger rebound to 1.0825-30 but price should falter well below said resistance at 1.0906, bring retreat later. In the unlikely event euro breaks above said last week’s high at 1.0906, this would extend the erratic rise from 1.0340 low to 1.0930-35 (61.8% Fibonacci retracement of 1.1300-1.0340), then towards 1.1000.
Recommendation: Stand aside for this week.
On the weekly chart, although the single currency opened higher last week, the subsequent deeper-than-expected retreat formed a long black candlestick, suggesting top has possibly been formed at 1.0906, hence consolidation below this level would be seen with mild downside b tis for test of 1.0600 support, break there would add credence to this view and bring further fall to 1.0525. Looking ahead, only a break of indicated pivotal support at 1.0493 would signal the rebound from 1.0340 has ended at 1.0906, bring further fall to key support at 1.0454, a sustained breach below this level would provide confirmation, then further fall to 1.0390-00 and later retest of this January low would follow.
On the upside, expect recovery to be limited to 1.0730-40 and bring another decline. Above 1.0780 would risk tabour to 1.0825-30 but price should falter well below said resistance at 1.0906, bring another decline later. Only a break of 1.0906 would revive near term bullish view for the erratic rise from 1.0340 low to bring retracement of recent decline to 1.0930-35 (61.8% Fibonacci retracement of 1.1300-1.0340) and possibly 1.1000, however, reckon upside would be limited to 1.1050-60 and price should falter below 1.1100-10, risk from there is seen for a retreat to take place later.