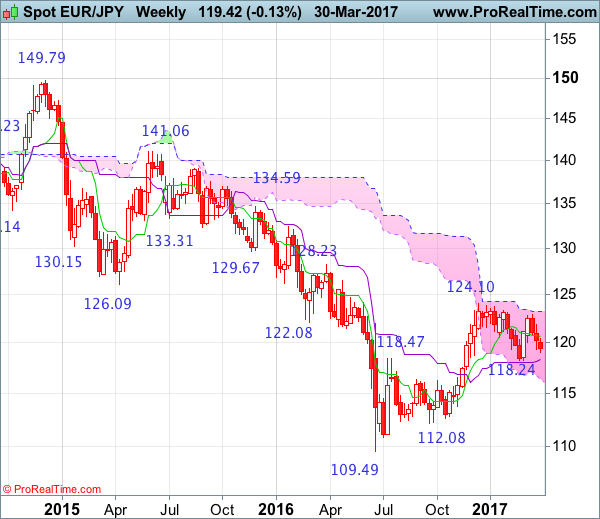
Weekly
• Last Candlesticks pattern: Hammer
• Time of formation: 19 Sep 2016
• Trend bias: Down
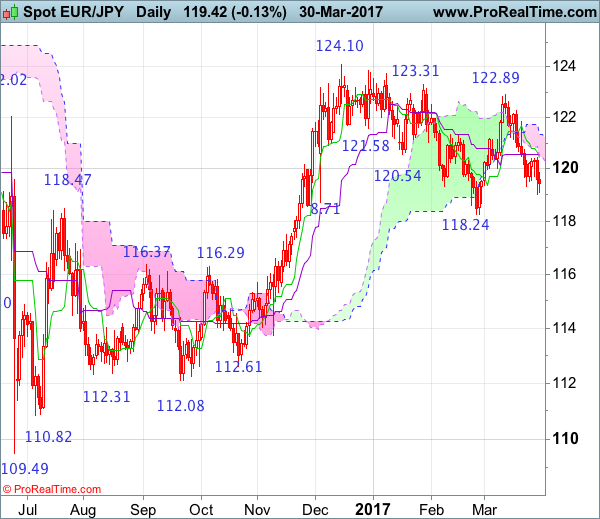
Daily
• Last Candlesticks pattern: Doji
• Time of formation: 28 Mar 2017
• Trend bias: Near term up
EUR/JPY – 119.54
As the single currency faltered just below the Kijun-Sen (now at 120.57) and slipped from 10.44 this week, suggesting the fall from 122.89 is still in progress and downside risk remains for the fall from there to extend weakness to 118.90-00, then 118.65-70, however, a daily close below latter level is needed to retain bearishness and bring retest of 118.24 support. Once this level is penetrated, this would signal the break of the erratic decline from 124.10 top has resumed and bring subsequent fall to 117.90-00, then towards 117.40-50 which is likely to hold from here due to oversold condition, bring rebound later.
On the upside, whilst initial recovery to 119.80-85 cannot be ruled out, reckon upside would be limited to the Kijun-Sen (now at 120.57) and bring another decline later. A daily close above 120.85 would defer and risk rebound to the upper Kumo (now at 121.35) but only break of resistance at 121.84 would revive bullishness and signal the fall from 122.89 has ended instead, bring further gain to 122.50, then retest of said resistance at 122.89. Looking ahead, a break there is needed to signal the rise from 118.24 low has resumed and extend further gain to resistance at 123.31, a daily close above this level would suggest the entire fall from 124.10 top has ended at 118.24 back in Feb and bring further subsequent headway towards this level.
Recommendation: Sell at 120.40 for 118.40 with stop above 121.40.
On the weekly chart, euro’s retreat from 122.89 has kept price under near term pressure, adding credence to our view that the rebound from 118.24 has ended there and downside risk remains for weakness to 119.00, then 118.65-70 but said support at 118.24 should remain intact, bring further choppy trading. In the event euro drops below 118.24 level, this would signal the retreat from 124.10 top is still in progress and near term downside bias remains for this move to bring retracement of recent upmove, hence weakness to the Kijun-Sen (now at 118.09) is likely but a weekly close below there is needed to signal the rise from 109.49 has ended, bring further decline to 117.30-35, however, previous resistance at 116.29 should contain downside due to near term oversold condition, bring rebound later.
On the upside, expect recovery to be limited to 120.00-10 and the Tenkan-Sen (now at 120.70) should hold from here, bring another decline later. Only above said resistance at 121.84 would suggest the pullback from 122.89 has ended instead, bring another test of this level, break there would signal the rebound from 118.24 is still in progress and may extend gain to indicated key resistance at 123.31. Looking ahead, a break above this level is needed to retain bullishness and signal recent rise from 109.49 low has resumed for retracement of early decline to 125.25-30 (50% Fibonacci retracement of 141.06-109.49), having said that, reckon resistance at 126.47 would cap upside and price should falter below resistance at 128.23, bring retreat later.