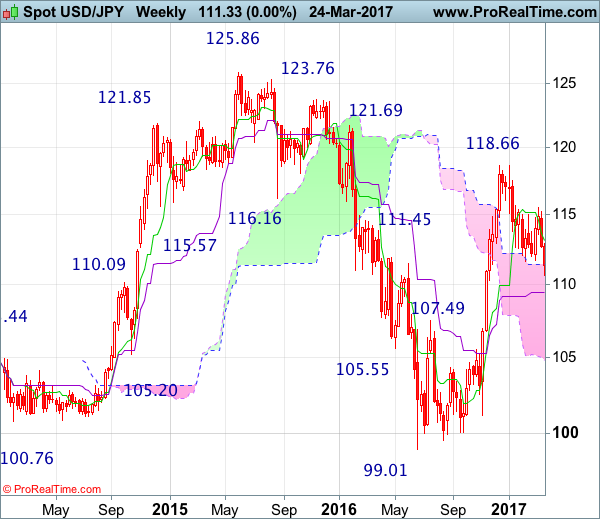
Weekly
• Last Candlesticks pattern: Hanging man
• Time of formation: 22 May 2016
• Trend bias: Down
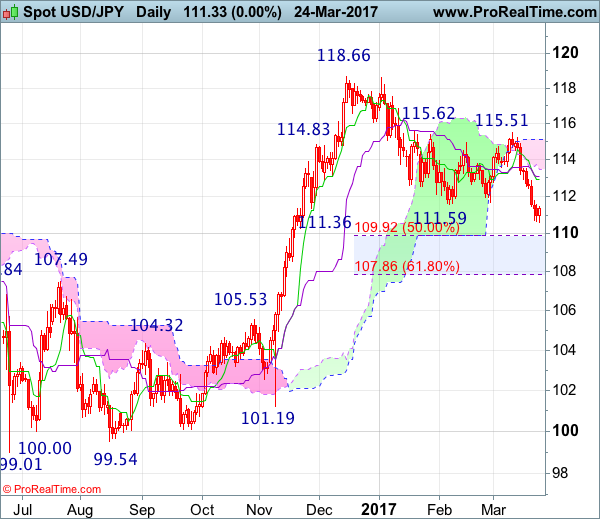
Daily
• Last Candlesticks pattern: Shooting star
• Time of formation: 15 Feb 2017
• Trend bias: Down
USD/JPY – 110.35
The greenback continued heading south after last week’s initial brief recovery to 112.90, adding credence to our bearish view that the erratic decline from 118.66 top is still in progress and may extend weakness to 109.90-95 (50% Fibonacci retracement of 101.19-118.66), then 109.50, however, reckon downside would be limited to 109.00 and previous support at 108.55 should hold from here, price should stay well above dynamic support at 107.85-90 (61.8% Fibonacci retracement of 101.19-118.66) and bring rebound later.
On the upside, whilst recovery to 110.90-00 cannot be ruled out, reckon resistance at 111.48 (Friday’s high) would limit upside and bring another decline later. Above 111.90-00 would defer but only break of resistance at 112.26 (previous support) would abort and suggest low is possibly formed, risk a stronger rebound to indicated resistance at 112.90 but a daily close above there is needed to add credence to this view, then subsequent rise to 113.54 resistance would follow.
Recommendation : Sell at 111.50 for 109.50 with stop above 112.50.
On the weekly chart, the greenback opened lower this week after last week’s selloff below previous support at 111.59, adding credence to our view that top has been formed at 118.66 earlier and the decline from there is still in progress for retracement of recent upmove to 109.90-95 (current level of the Kijun-Sen and 50% Fibonacci retracement of 101.19-118.66), then 109.00 but reckon support at 108.55 would limit downside and price should stay above 107.85-90 (61.8% Fibonacci retracement), risk from there is seen for a rebound later.
On the upside, although initial recovery to 110.90-00 is likely reckon resistance at 111.48 (Friday’s high) would attract renewed selling interest and bring another decline later. Above previous support at 112.26 (now resistance) would defer and suggest a temporary low is formed, bring test of the Tenkan-Sen (now at 112.82), a weekly close above there would add credence to this view, then further gain to 113.54 resistance would follow.