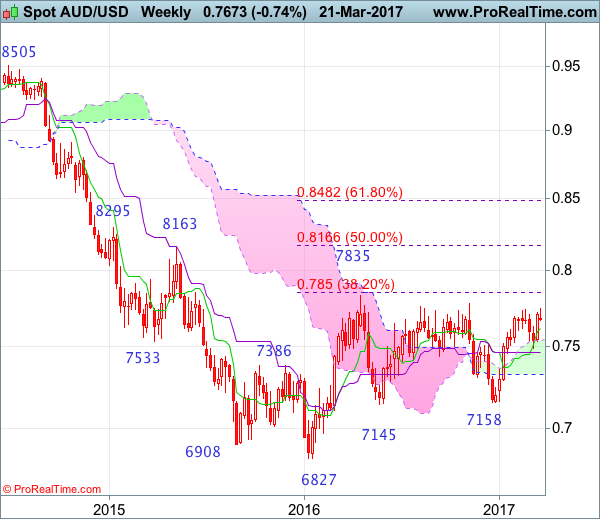
Weekly
• Last Candlesticks pattern: Morning star
• Time of formation: 2 Jan 2017
• Trend bias: Sideways
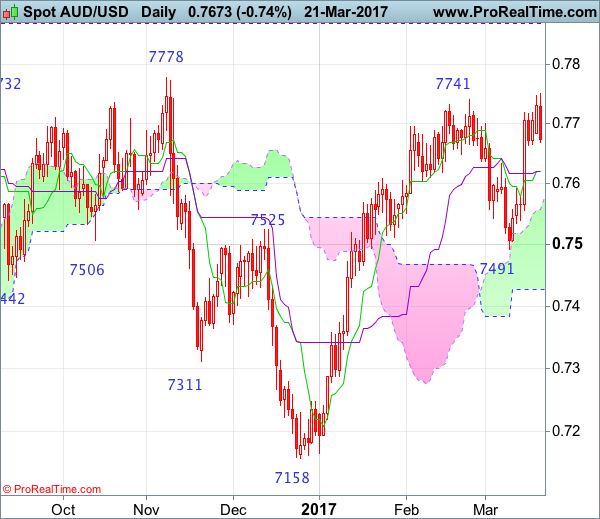
Daily
• Last Candlesticks pattern: Long white candlestick
• Time of formation: 15 Mar 2017
• Trend bias: Up
Last week’s rally has reinforced our bullishness and formed a long white candlestick on the daily chart, our long position entered at 0.7515 reached our indicated upside target at 0.7715 and upside bias remains for further gain to previous chart resistance at 0.7778, however, break there is needed to retain bullishness and confirm early erratic upmove from 0.6827 (2016 low) has resumed for retest of 0.7835 (2016 high) first but near term overbought condition should prevent sharp move beyond 0.7900-10 and price should falter well below psychological resistance at 0.8000.
On the downside, whilst pullback to 0.7700 cannot be ruled out, reckon downside would be limited to 0.7640-50 and the Kijun-Sen (now at 0.7620) should hold, bring another rise later. A daily close below the Kijun-Sen would defer and suggest top is possibly formed, bring correction towards the upper Kumo (now at 0.7558) and then 0.7540, however, price should stay well above support at 0.7491, bring another upmove later.
Recommendation: Long entered at 0.7515 met target at 0.7715 with 200 points profit and would buy again at 0.7600 for 0.7800 with stop below 0.7500.
On the weekly chart, aussie did find renewed buying interest at 0.7491 and has rallied in line with our bullish expectations, the breach of indicated resistance at 0.7741 adds credence to our view that the rebound from 0.7158 is still in progress for retest of resistance at 0.7778, however, as broad outlook remains consolidative, reckon upside would be limited and price should falter below 2016 high at 0.7835. Looking ahead, only above this level would suggest an upside break of recent established broad range has occurred, bring further subsequent rise to 0.7900 and later towards psychological level at 0.8000.
On the downside, although pullback to 0.7680-85 cannot be ruled out, reckon downside would bw limited to 0.7640-50 and bring another rise. A weekly close below the Tenkan-Sen (now at 0.7621) would defer and risk correction to 0.7570-75 but support at 0.7491 should remain intact, bring another rise later. Only a drop below 0.7491 would abort and signal the rise from 0.7158 has ended instead, risk further fall to the Kijun-Sen (now at 0.7468) and possibly 0.7400.