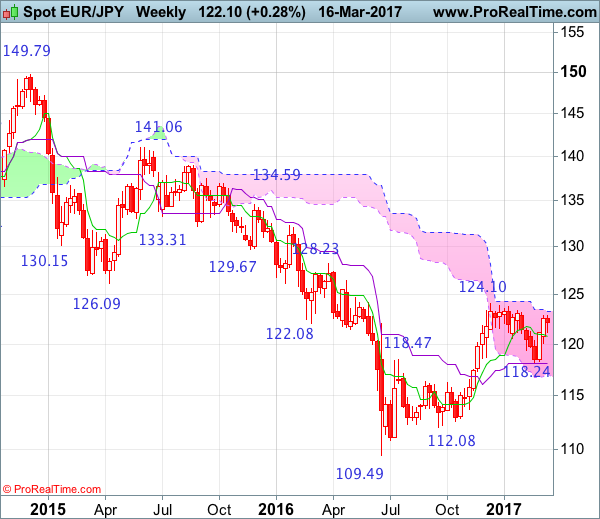
Weekly
- Last Candlesticks pattern: Hammer
- Time of formation: 19 Sep 2016
- Trend bias: Down
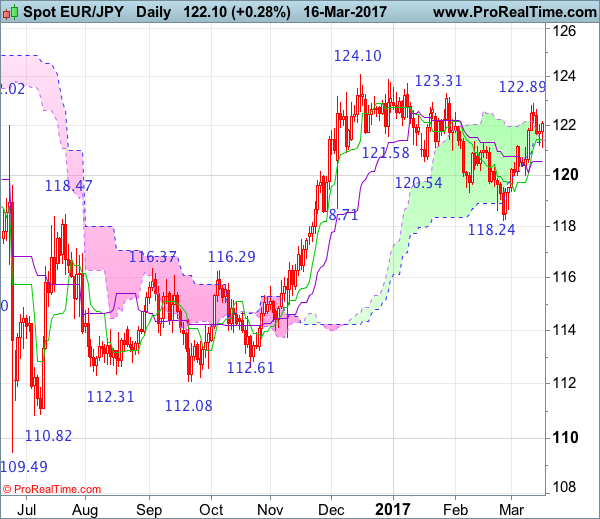
Daily
- Last Candlesticks pattern: Hammer
- Time of formation: 9 Nov 2016
- Trend bias: Near term up
EUR/JPY – 122.09
Although the single currency slipped to 121.13 yesterday, as euro found renewed buying interest there and has rebounded, suggesting the pullback from 122.89 has possibly ended there and consolidation with upside bias is seen for gain towards this level, however, break there is needed to signal the rise from 118.24 low has resumed and extend further gain to resistance at 123.31. Looking ahead, only a daily close above resistance at 123.31 would signal the entire fall from 124.10 top has ended at 118.24 back in Feb and bring further subsequent rise towards this level which is likely to hold on first testing.
On the downside, whilst initial pullback to 121.70 cannot be ruled out, reckon the Tenkan-Sen (now at 121.46) would limit downside and bring another upmove later. A drop below said support at 121.13 would abort and suggest top is possibly formed at 122.89, bring further weakness to 120.65-70, then towards support at 120.02, only a daily close below the latter level would provide confirmation, bring further fall to 119.50-60 and possibly 119.00 but still reckon 118.80 would limit downside and price should stay well above said support at 118.24, bring another rebound later.
Recommendation: Buy at 121.50 for 123.50 with stop below 120.50.
On the weekly chart, the single currency has maintained a firm undertone after last week’s rise to 122.89, suggesting bullishness remains for the rebound from 118.24 is still in progress and may extend gain to indicated key resistance at 123.31. Looking ahead, only above this level would signal recent rise from 109.49 low has resumed for retracement of early decline to 125.25-30 (50% Fibonacci retracement of 141.06-109.49), having said that, reckon resistance at 126.47 would cap upside and price should falter below resistance at 128.23, bring retreat later.
On the downside, expect pullback to be limited to 121.40-50 and the Tenkan-Sen (now at 120.78) should hold, bring another rise later to aforesaid upside targets. Only below support at 120.02 (last week’s low) would defer and risk weakness to 119.30-35 but a drop below 118.80 is needed to suggest the rebound from 118.24 has ended, bring retest of this level, a break there would signal the retreat from 124.10 top is still in progress and near term downside bias remains for this move to bring retracement of recent upmove, hence weakness towards the Kijun-Sen (now at 118.09), however, a weekly close below there is needed to signal the rise from 109.49 has ended, bring further decline to 117.30-35 but previous resistance at 116.29 should contain downside due to near term oversold condition, bring rebound later.