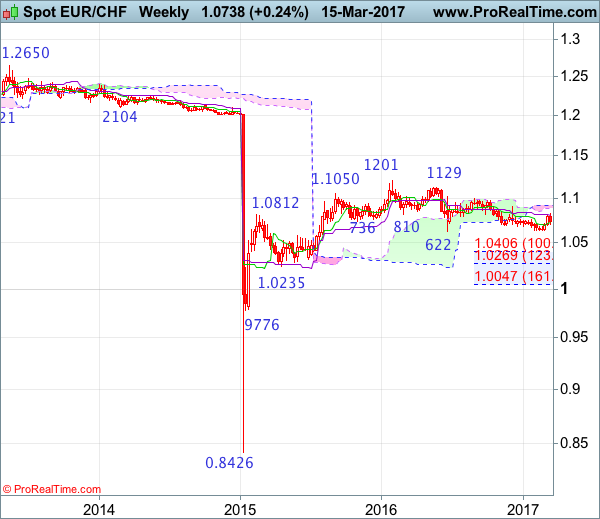
Weekly
- Last Candlesticks pattern: Shooting star
- Time of formation: 1 Feb 2016
- Trend bias: Up
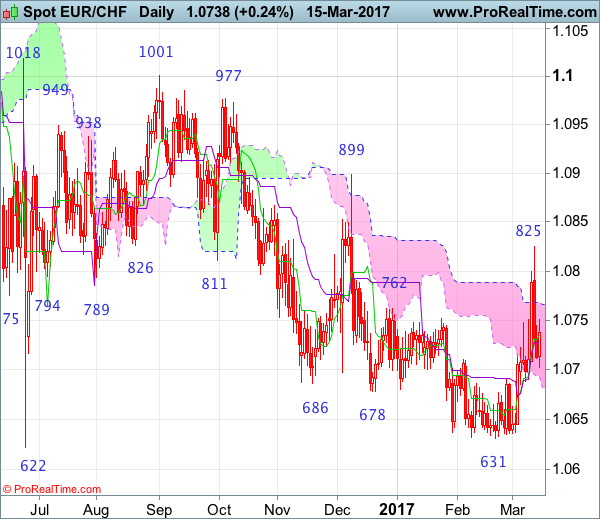
Daily
- Last Candlesticks pattern: Doji
- Time of formation: 1 Sep 2016
- Trend bias: Near term down
EUR/CHF – 1.0711
Although the single currency staged a strong rebound to 1.0825 earlier this week, lack of follow through buying and the subsequent retreat suggest further consolidation would take place and weakness to 1.0670 cannot be ruled out, however, reckon downside would be limited and last month’s low at 1.0631 should remain intact, bring another rebound later. Above 1.0770 would bring test of said resistance at 1.0825 but break there is needed to signal low has been formed, bring further subsequent gain to 1.0850 but price should falter below key resistance at 1.0899 (Dec high), risk from there is seen for a retreat later.
On the downside, whilst pullback to 1.0660-70 cannot be ruled out, reckon downside would be limited and said strong support at 1.0631 should remain intact, bring another rebound later. Only a break below support at 1.0622-31 would confirm the erratic decline from 1.1201 (2016 high) has resumed for further fall to 1.0590-00, then towards 1.0530-35 but loss of downward momentum should prevent sharp fall below 1.0500, price should stay well above 1.0400-10, risk from there has increased for a strong rebound to take place later.
Recommendation: Stand aside for this week.
On the weekly chart, despite this week’s initial rise to 1.0825, lack of follow through buying and the subsequent retreat look set to form a black candlestick this week and consolidation with initial downside bias is seen for weakness to 1.0660-70, however, break of support at 1.0622-31 is needed to signal recent decline from 1.1201 top is still in progress and may extend further fall to 1.0550-55, then 1.0500-10, however, oversold condition should prevent sharp fall below 1.0400-10 (100% projection of 1.1201-1.0622 measuring from 1.1001) and price should stay well above previous support at 1.0314, risk from there is seen for a rebound to take place later.
On the upside, above said resistance at 1.0825 would signal low has been formed at 1.0631, bring retracement of recent decline to 1.0850 but a break above indicated resistance at 1.0899 is needed to add credence to this view and bring a stronger rebound to 1.0970-75, then test of 1.1001. Looking ahead, only a sustained breach above 1.1001 would signal the fall from 1.1201 has ended, bring further gain to 1.1100 but reckon resistance at 1.1129 would hold on first testing.