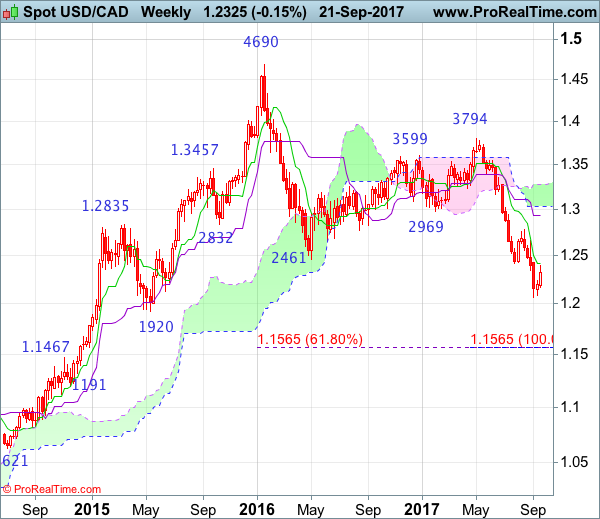
Weekly
• Last Candlesticks pattern: Shooting doji
• Time of formation: 01 May 2017
• Trend bias: Sideway
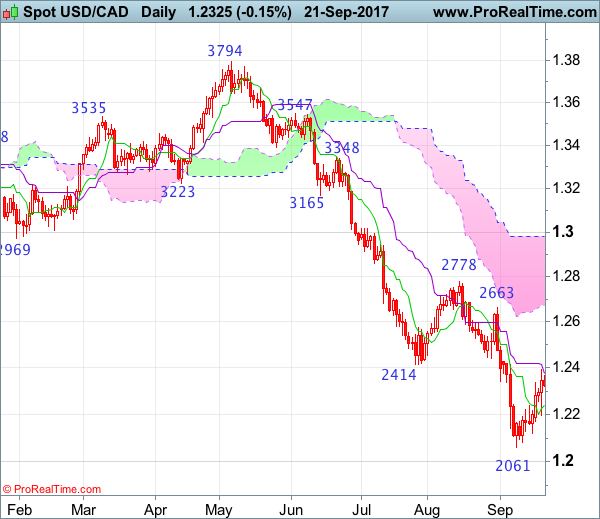
Daily
• Last Candlesticks pattern: Bearish engulfing
• Time of formation: 5 May 2017
• Trend bias: Down
USD/CAD – 1.2300
As the greenback found support at 1.2197 and has rebounded again, suggesting further consolidation above recent low at 1.2061 would be seen and near term upside risk remains for the corrective rise from there to bring retracement of recent decline, hence gain to 1.2415 resistance and then test of previous support at 1.2441, above latter level would bring a stronger rebound to 1.2500 and then 1.2520-25, however, near term overbought condition should prevent sharp move beyond 1.2560-70 and price should falter well below resistance at 1.2663, bring retreat later.
On the downside, expect pullback to be limited to 1.2270 and the Tenkan-Sen (now at 1.2237) should hold, bring another rebound later. A daily close below said support at 1.2197 would suggest the rebound from 1.2061 has ended, bring further fall to 1.2140-50, then test of support at 1.2121 but break of latter level is needed to signal recent decline has resumed and bring retest of 1.2061. Looking ahead, below 1.2061would extend downtrend to psychological level at 1.2000, having said that, loss of momentum should prevent sharp fall below 1.1920-25 (61.8% projection) and 1.1900 should hold.
Recommendation: Take profit on our short position entered at 1.2340 and stand aside for this week.
On the weekly chart, this week’s rebound looks set to form another white candlestick and further consolidation above this month’s low at 1.2061 would take place and another corrective bounce to 1.2414-20 (previous support and current level of the Tenkan-Sen) cannot be ruled out, however, reckon upside would be limited to 1.2500 and 1.2600 should hold. Only a weekly close above resistance at 1.2663 is needed to signal a temporary low has been formed at 1.2061, bring retracement of recent decline towards resistance at 1.2778 which is likely to hold from here.
On the downside, whilst pullback to 1.2270 cannot be ruled out, reckon 1.2220-30 would hold and bring another rebound, below this week’s low at 1.2171 would suggest the rebound from 1.2061 has ended, bring test of 1.2121, break there would signal decline from 1.3794 top has resumed for retest of 1.2061, break there would extend weakness towards psychological support at 1.2000, however, reckon downside would be limited to 1.1920-25 (61.8% projection of 1.3794-1.2414 measuring from 1.2778) and reckon 1.1840-50 would hold from here, price should stay above 1.1750-60, bring rebound later.